What are UML Component Diagrams?
Component diagrams describe the way a system is organized and the dependencies between its various components.
Unlike most UML diagrams which visualize a system’s activities, component diagrams provide a visualization of the components that create those activities. An effective component diagram shows the scope, structure, and goals of a system.
UML component diagrams are similar, but slightly different, to the component diagrams you might create as part of the C4 model. They are also similar to class diagrams in that they both describe the relationships between parts of a system, but component diagrams are typically more detailed and complex than class diagrams.
Ready to make a component diagram online? Start your free trial of Gliffy now!
What Is a Component Diagram Used For?
Component diagrams show the relationships between a system’s components structurally rather than behaviorally. Because of this, they are often used for modeling a system’s structure before building and ensuring that all required functions are met. They are also used to communicate the functions of a system being built to stakeholders.
However, they’re not limited to the planning process. Creating component diagrams for existing systems can be valuable for context, collaboration, and development.
Back to topComponent Diagram Symbols You’ll Need to Know
Here are a few of the most common shapes and notations used for creating component diagrams. These are all included in Gliffy’s UML shape library.
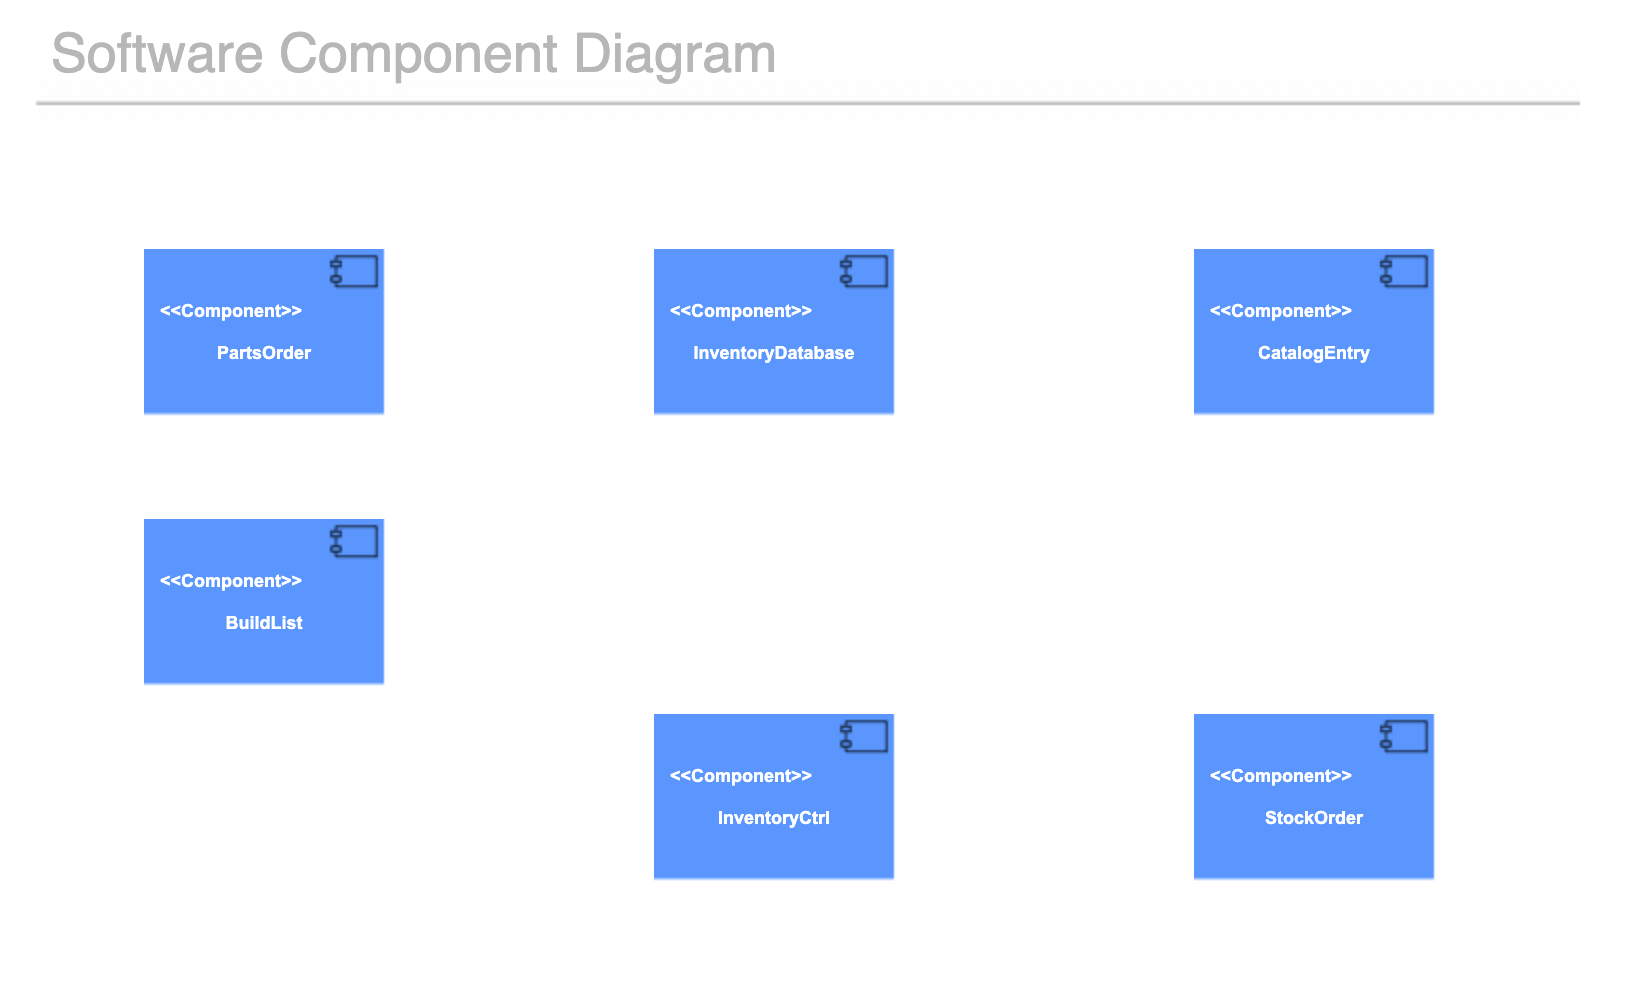
Components
Components are the main element of a component diagram. These are any entity that executes functions, either by providing or consuming inputs through interfaces or other components. Components are identified by the <<component>> label, the component symbol within the shape, or both.
Interfaces
Interfaces show the information either created by or required for a component’s activity and are represented by a line with an attached circle. A full circle is a provided interface, meaning the component produces information which is required for another component to function. A half circle is a required interface, or information that a component needs from another component in order to function.
Ports
Ports are squares that indicate a separate interaction point between a component and the external environment. An example of this can be input from a user or other actor outside the system.
Dependencies
Dependencies are dashed lines that show that one part of the system depends on another. If one component requires information or input from another, that is an example of a dependency.
Packages
Packages are groups of multiple elements in the system that are related and can be drawn to include more than one component.
Back to topHow to Make a Component Diagram
Here are a few easy steps to make a component diagram in Gliffy, the top diagramming app for Confluence. You can include your component diagram and other UML diagrams or application architecture diagrams directly alongside other technical documentation.
1. Open a Template or Get UML Shapes
When you open Gliffy, you can choose to select a template. In the UML category, you will find several component diagram templates to start from. However, you can also create your own component diagram from scratch by opening a blank document and making sure that you have the UML shape library selected by clicking “More Shapes” in the lower left.
2. Add Your Component Shapes
Add each component of the system and label them accordingly. Arrange them on the canvas in a way that makes sense with how you will connect them later.
3. Connect Components With Interfaces, Dependencies, and Ports
Connect your components with the interfaces, dependencies, and ports that are necessary to fully describe the system’s structure.

4. Make the Final Touches
Add any last touches or details that might provide necessary context for your component diagram. This could include drawing packages around multiple components or adding notes. You can also ensure everything is evenly aligned to create a presentation-ready diagram — check out this video on aligning and distributing shapes in Gliffy.
5. Save and Share with the Team
In Gliffy for Confluence, clicking the save button will automatically embed your diagram in the Confluence page you're working on, but you can also share the link to the diagram directly. Creating diagrams that are accessible and easy to understand is a great way to eliminate silo mentality and encourage better cross-functional collaboration.
Back to topDocument Your System Smoothly and Easily
Gliffy makes it easy to document complex systems, whether you’re at the beginning of the planning process or documenting an existing system. Start your free trial of Gliffy for Confluence today to bring a visual element to your technical documentation.