Why Pair Gliffy with Confluence?
Representing your system in a visual format helps your team reference information fast and communicate your work to non-technical stakeholders.
Gliffy allows you to visualize all types of architecture diagrams in Confluence:
- Cloud architecture diagrams
- Data flow models
- Dependency diagrams
To make cross-functional communication more effective, Gliffy allows you to organize your architecture diagrams by varying levels of detail with interactive layers.
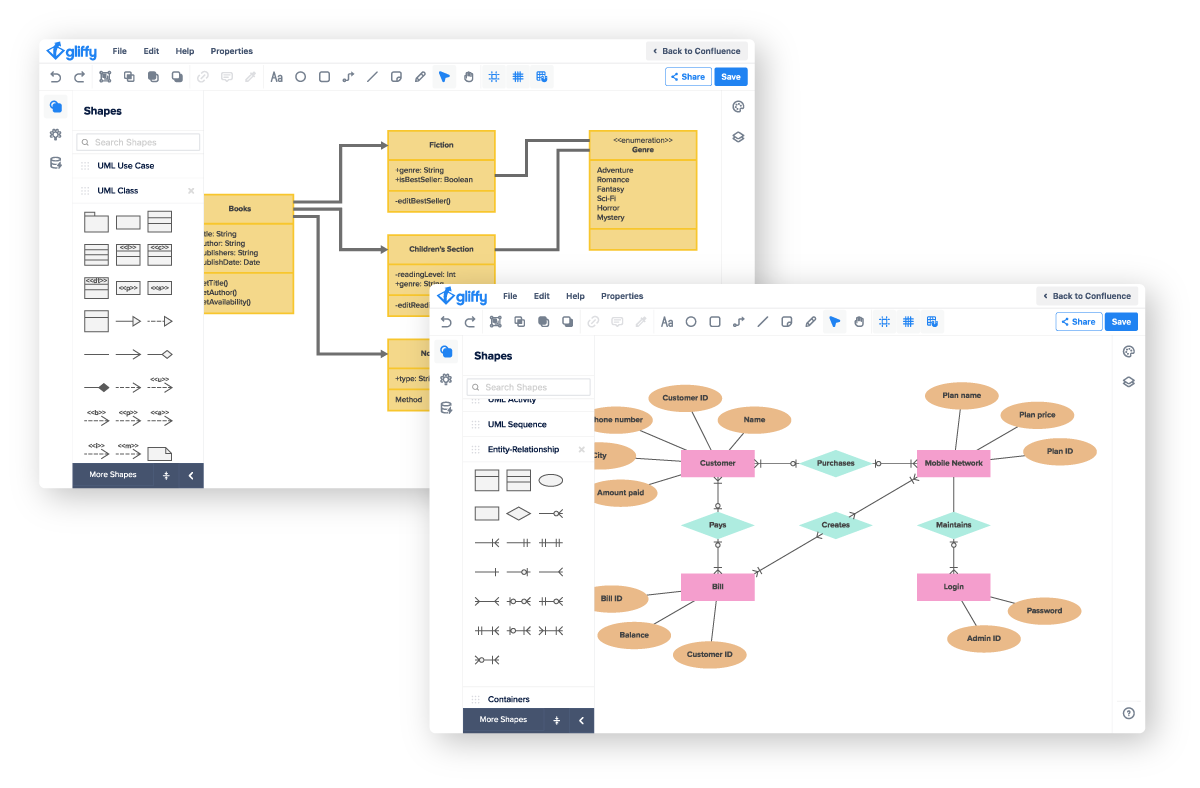
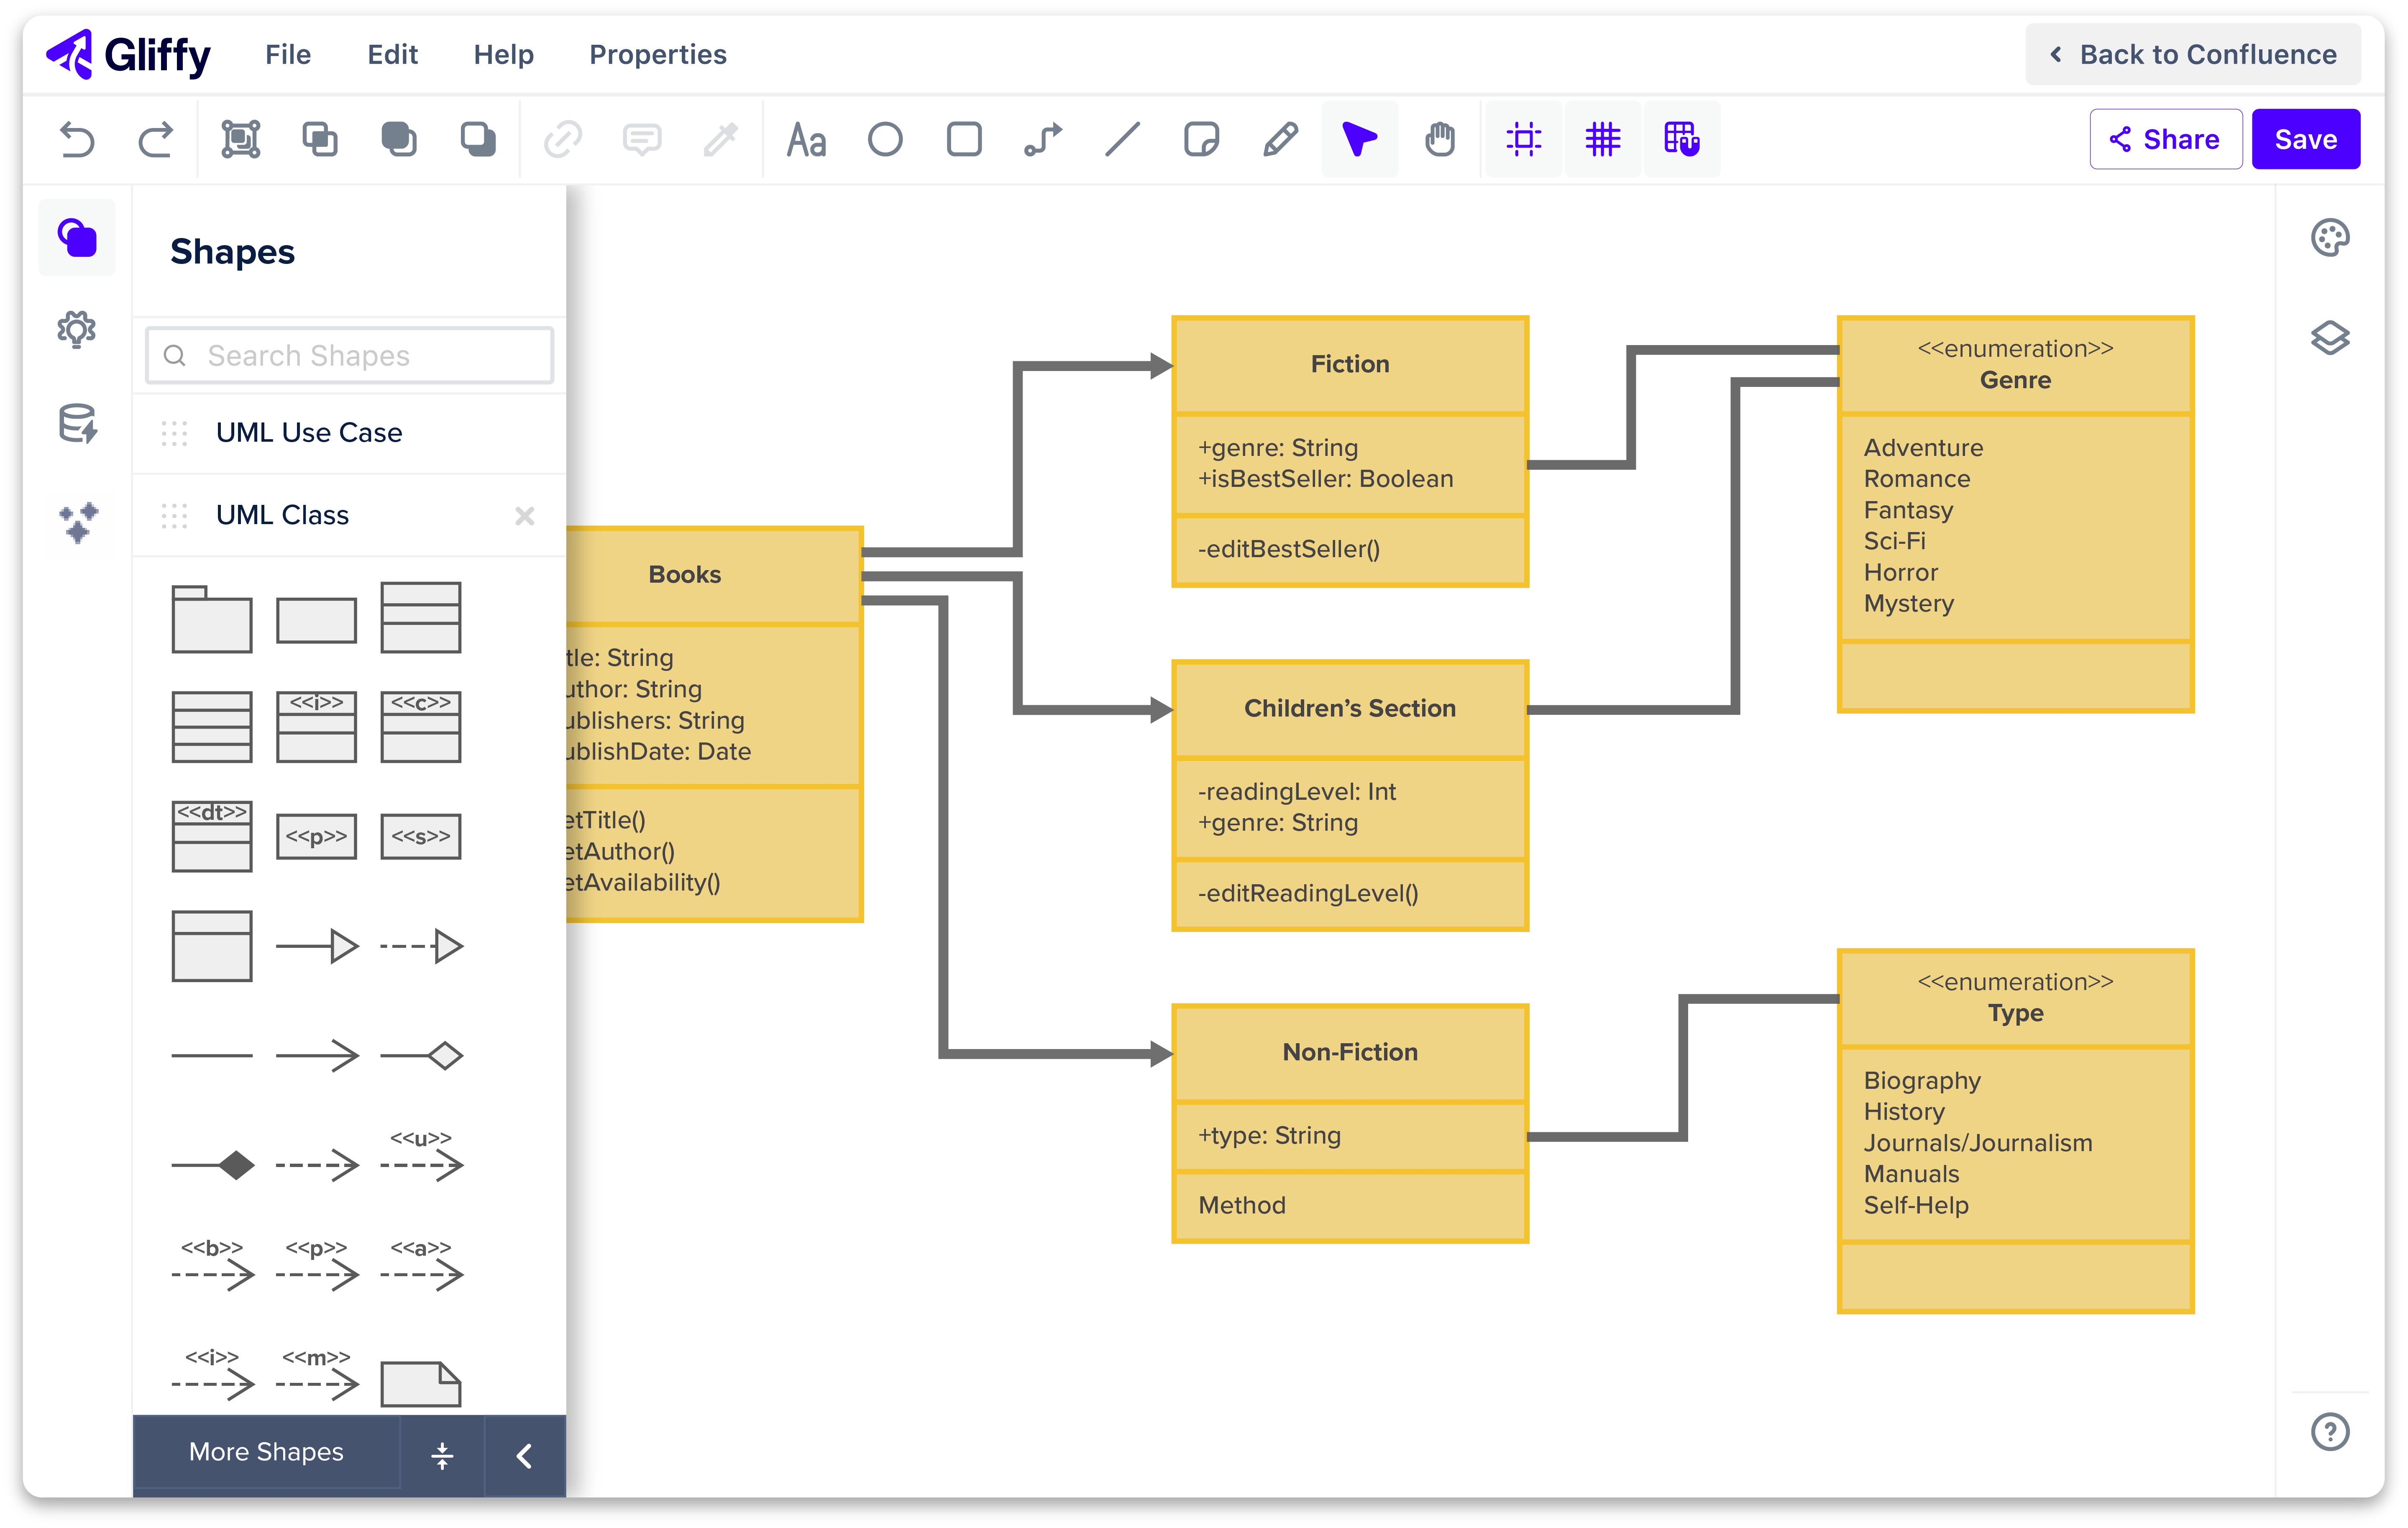
UML diagramming helps your team identify potential issues before ever writing a line of code and understand the logic behind a project’s structure after it’s completed.
With Gliffy, you can create UML diagrams directly in Confluence:
- Class diagrams
- Sequence diagrams
- State diagrams
Plus, Gliffy makes the UML diagramming process even faster with AI diagram generation in Confluence Cloud.
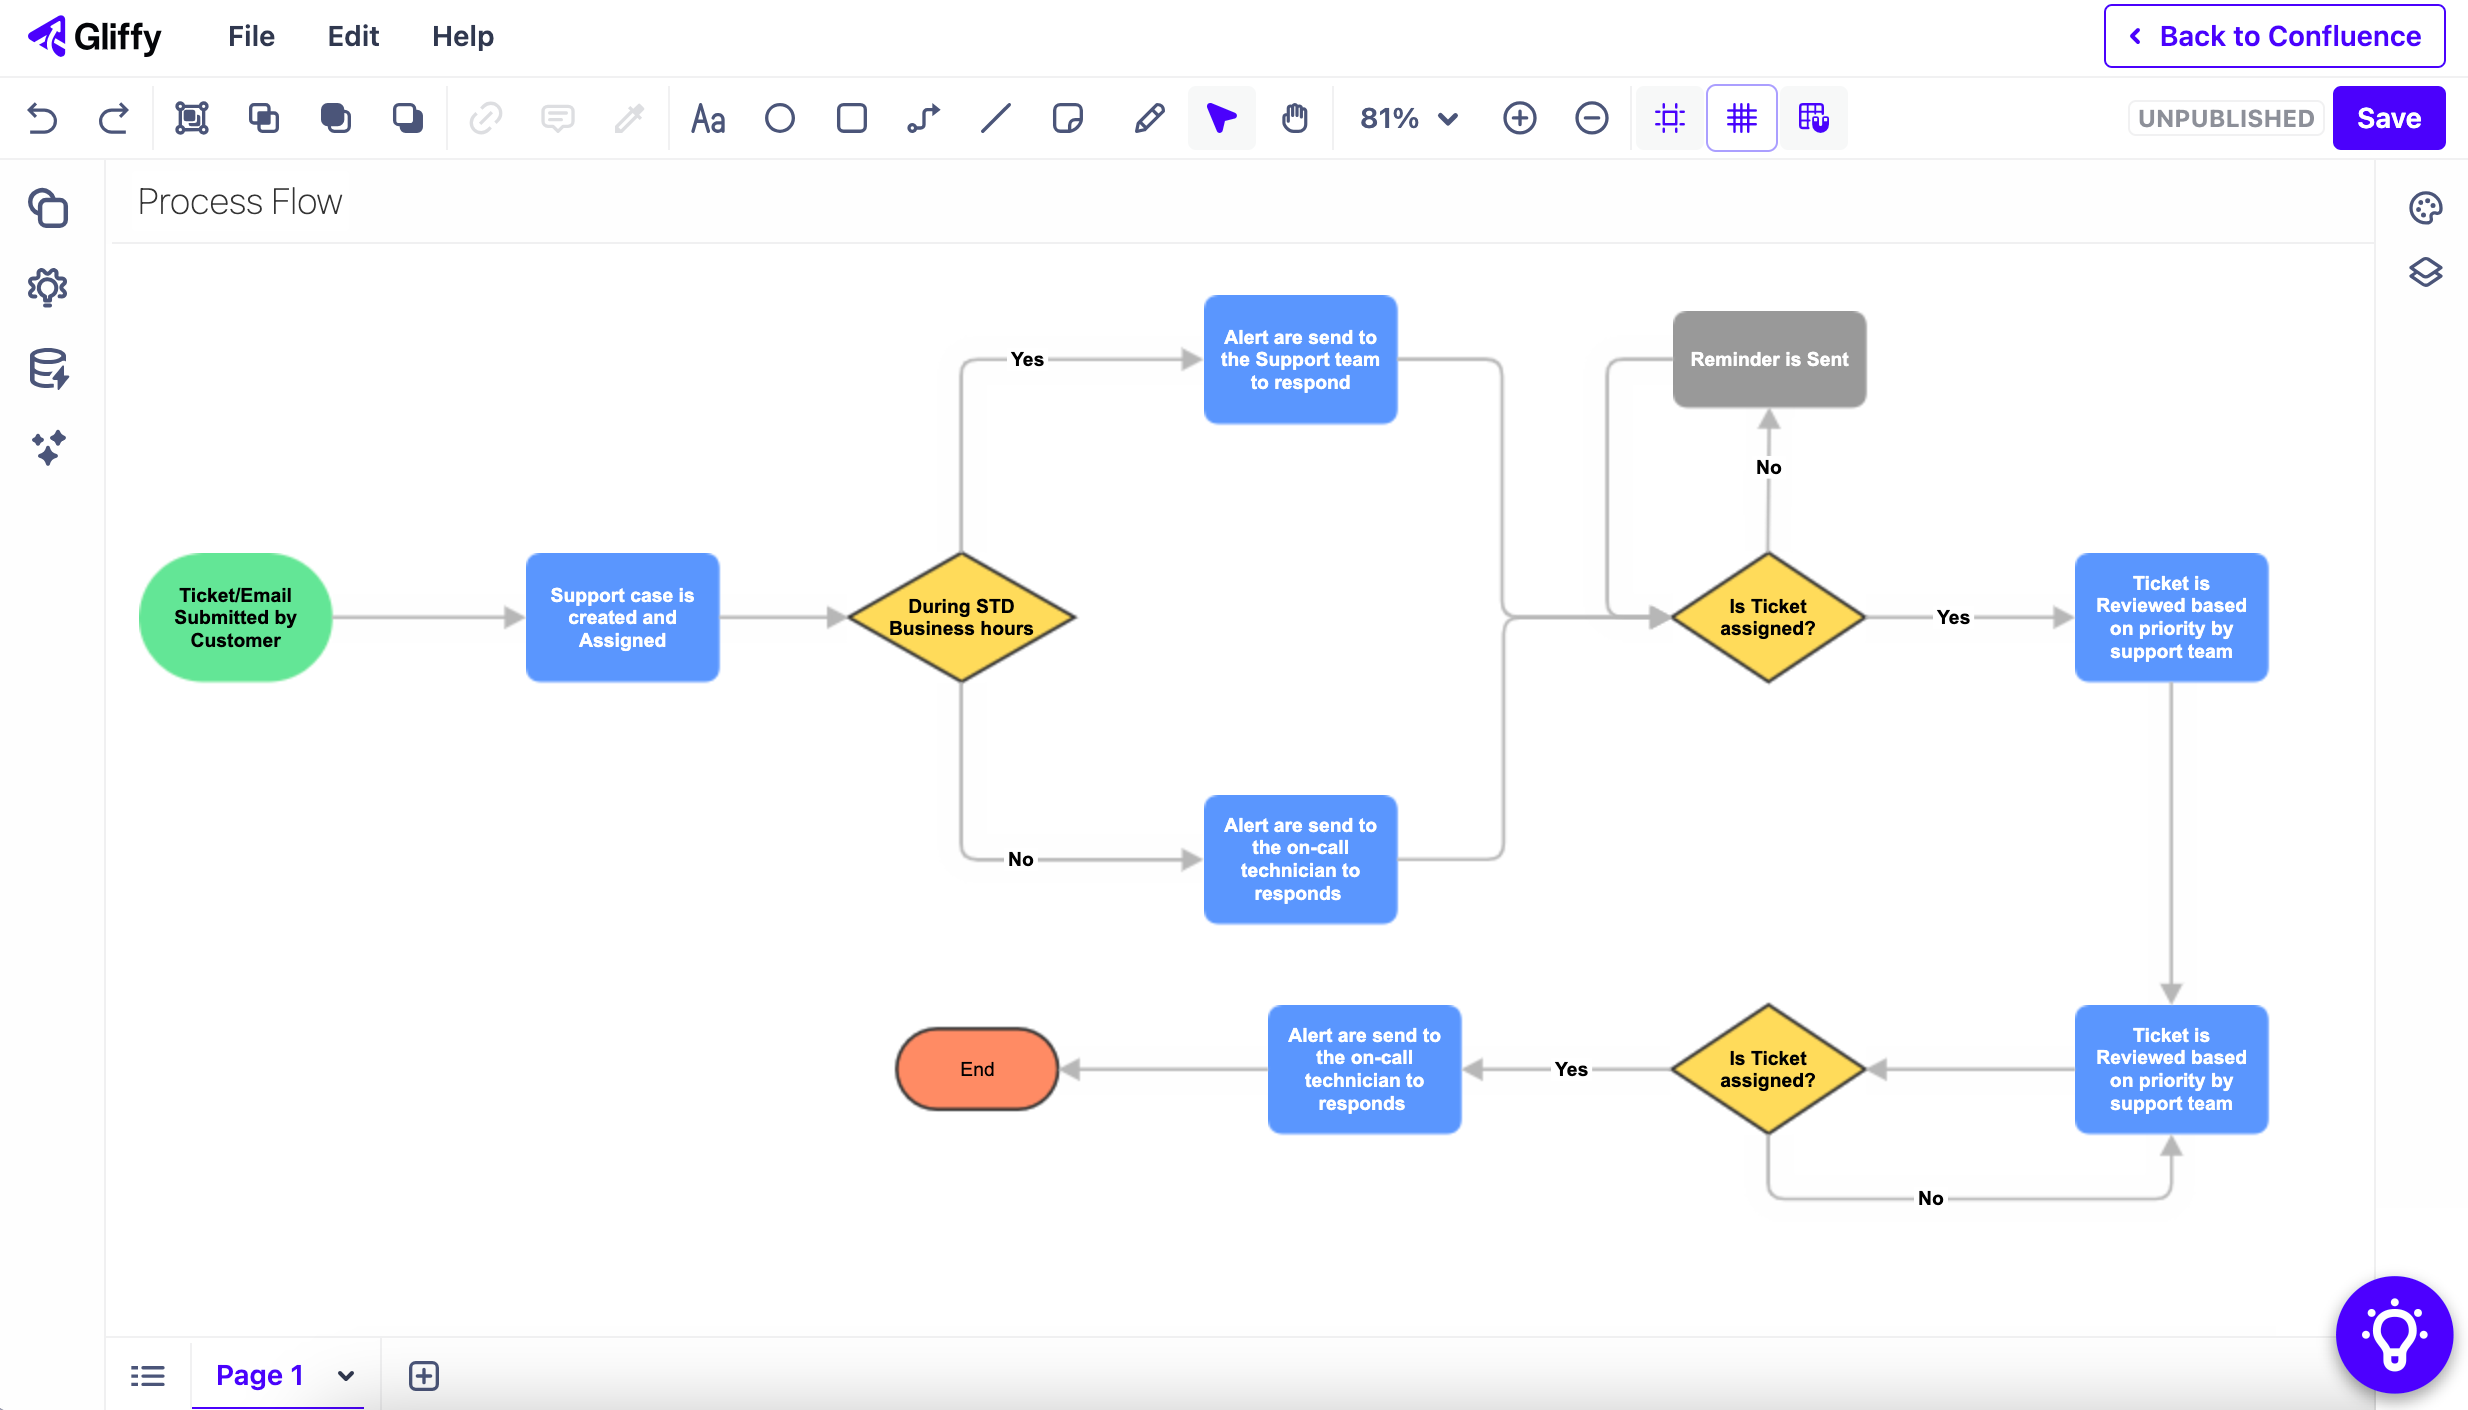
From planning and research to execution and delivery, delivering great software relies on a number of processes. You can streamline your team’s processes by seamlessly visualizing them where you already work.
Gliffy allows you to visualize processes across the development lifecycle with diagrams like:
- Process models
- Gitflow diagrams
- Workflow diagrams
Everything is fully searchable in Confluence, making your diagrams a true resource for your team.
"I do all sorts of software design and architecture diagramming with Gliffy. I am able to capture a variety of perspectives on a given system in this way and the resulting diagrams are extremely helpful for my colleagues to get up to speed on the structure of the system.”
Enhance Knowledge Sharing Across Your Organization
You don’t need to be an engineer to communicate complex information with Gliffy. Wherever your organization works within the Atlassian ecosystem, Gliffy is there to help each team make the most of their knowledge base.
Get the Diagramming Tool Built for Software & IT Teams
How to Start Diagramming Now
Atlassian Users
Learn how to request Gliffy from your organization’s Confluence administrator.