Why Pair Gliffy with Confluence?
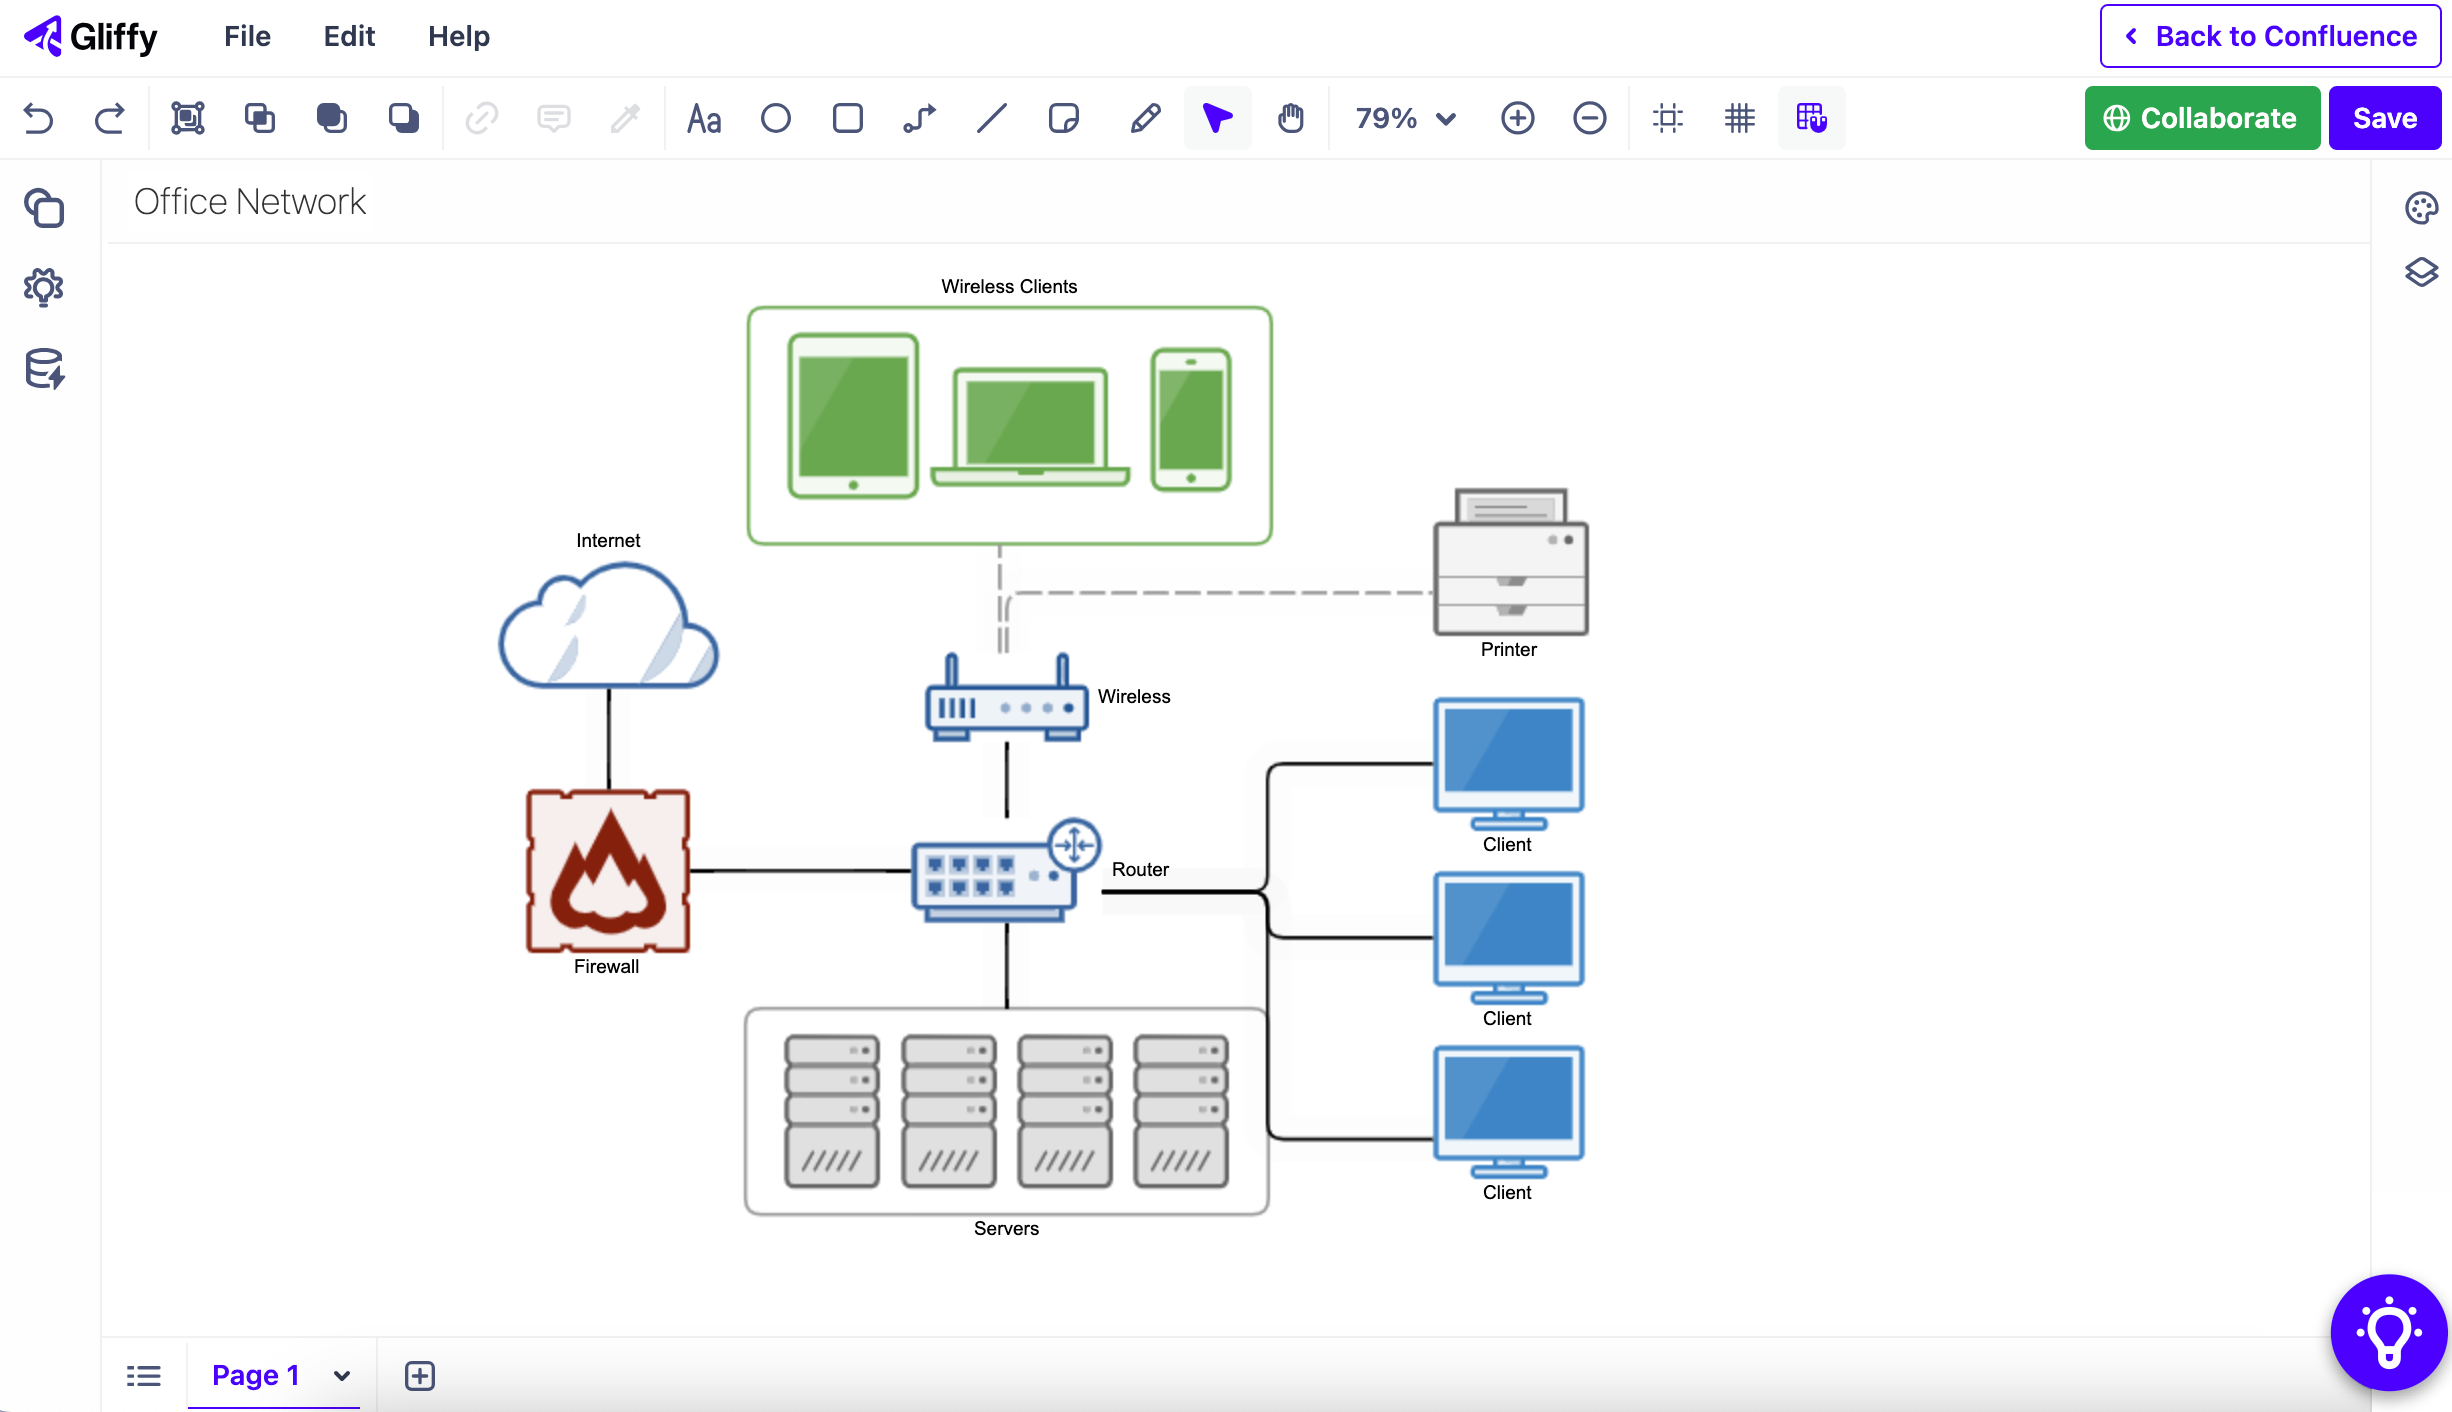
With a visual representation of your network’s structure, you’ll be better equipped to identify issues and inefficiencies, onboard new team members quickly, and plan expansion and infrastructure changes.
Gliffy makes it easy for you to visualize even the most complex networks with an intuitive drag-and-drop interface and robust in-product onboarding guides.
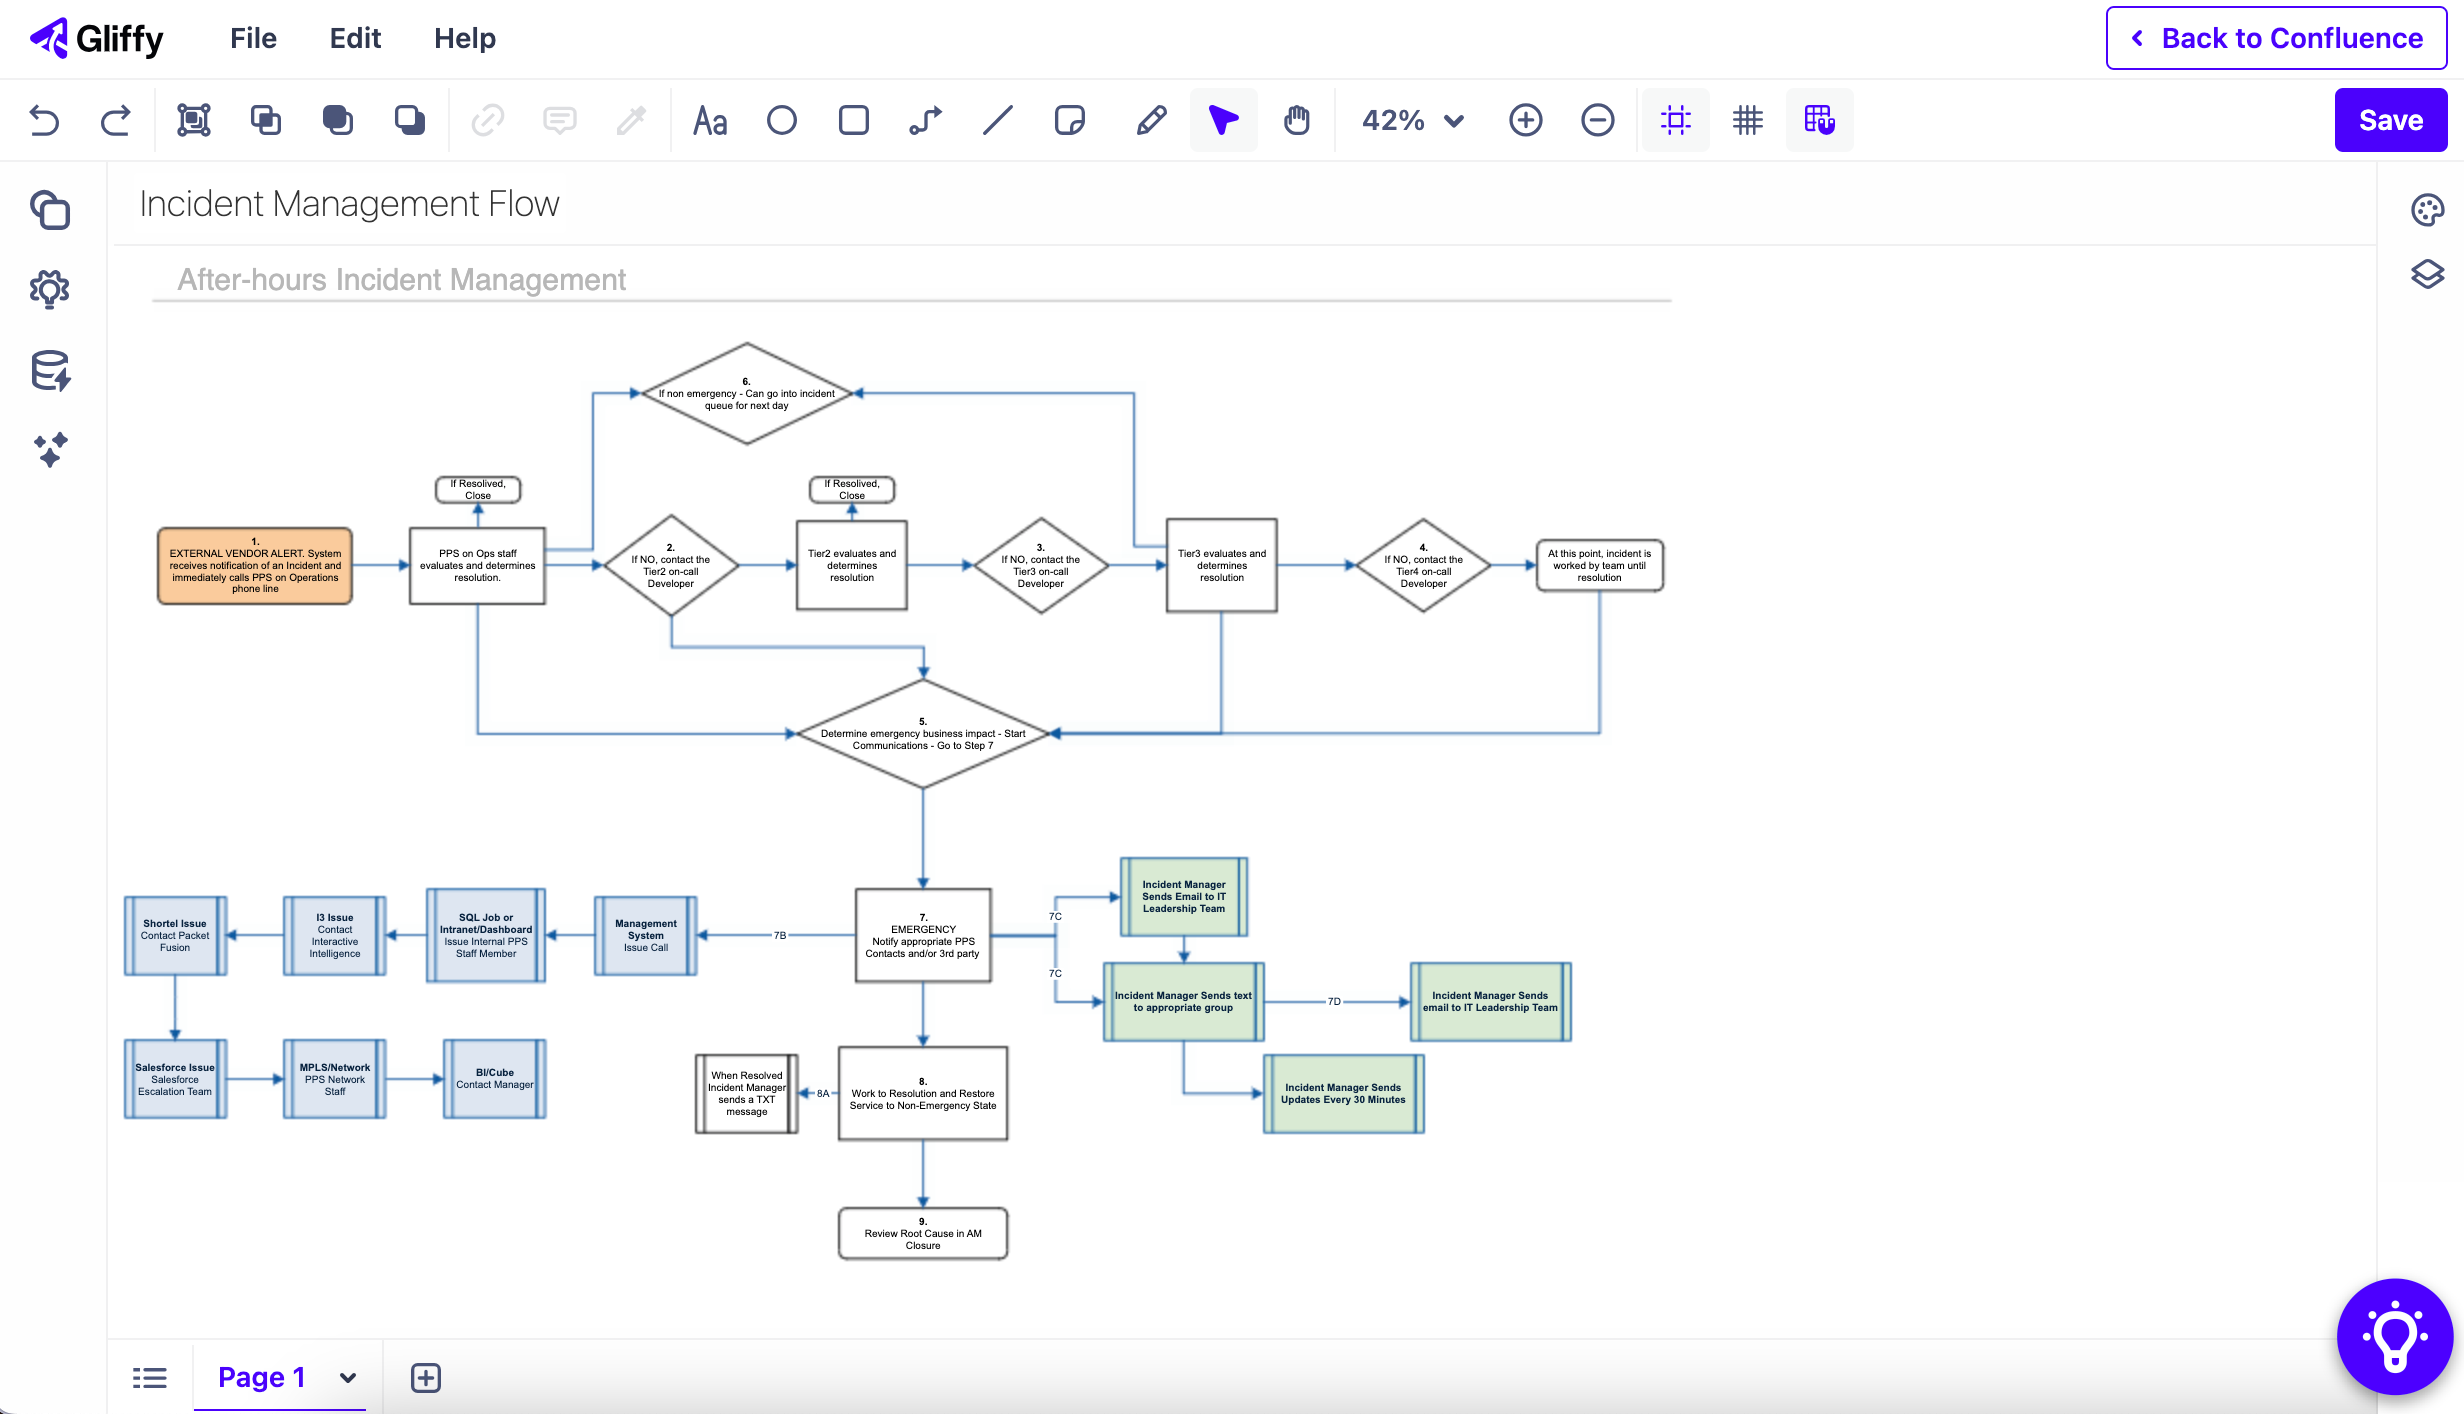
Building visual models prevents bottlenecks and miscommunications, helping your team work better together.
From incident management to request management and everything in between, Gliffy can help you visualize every IT process alongside the rest of your documentation.
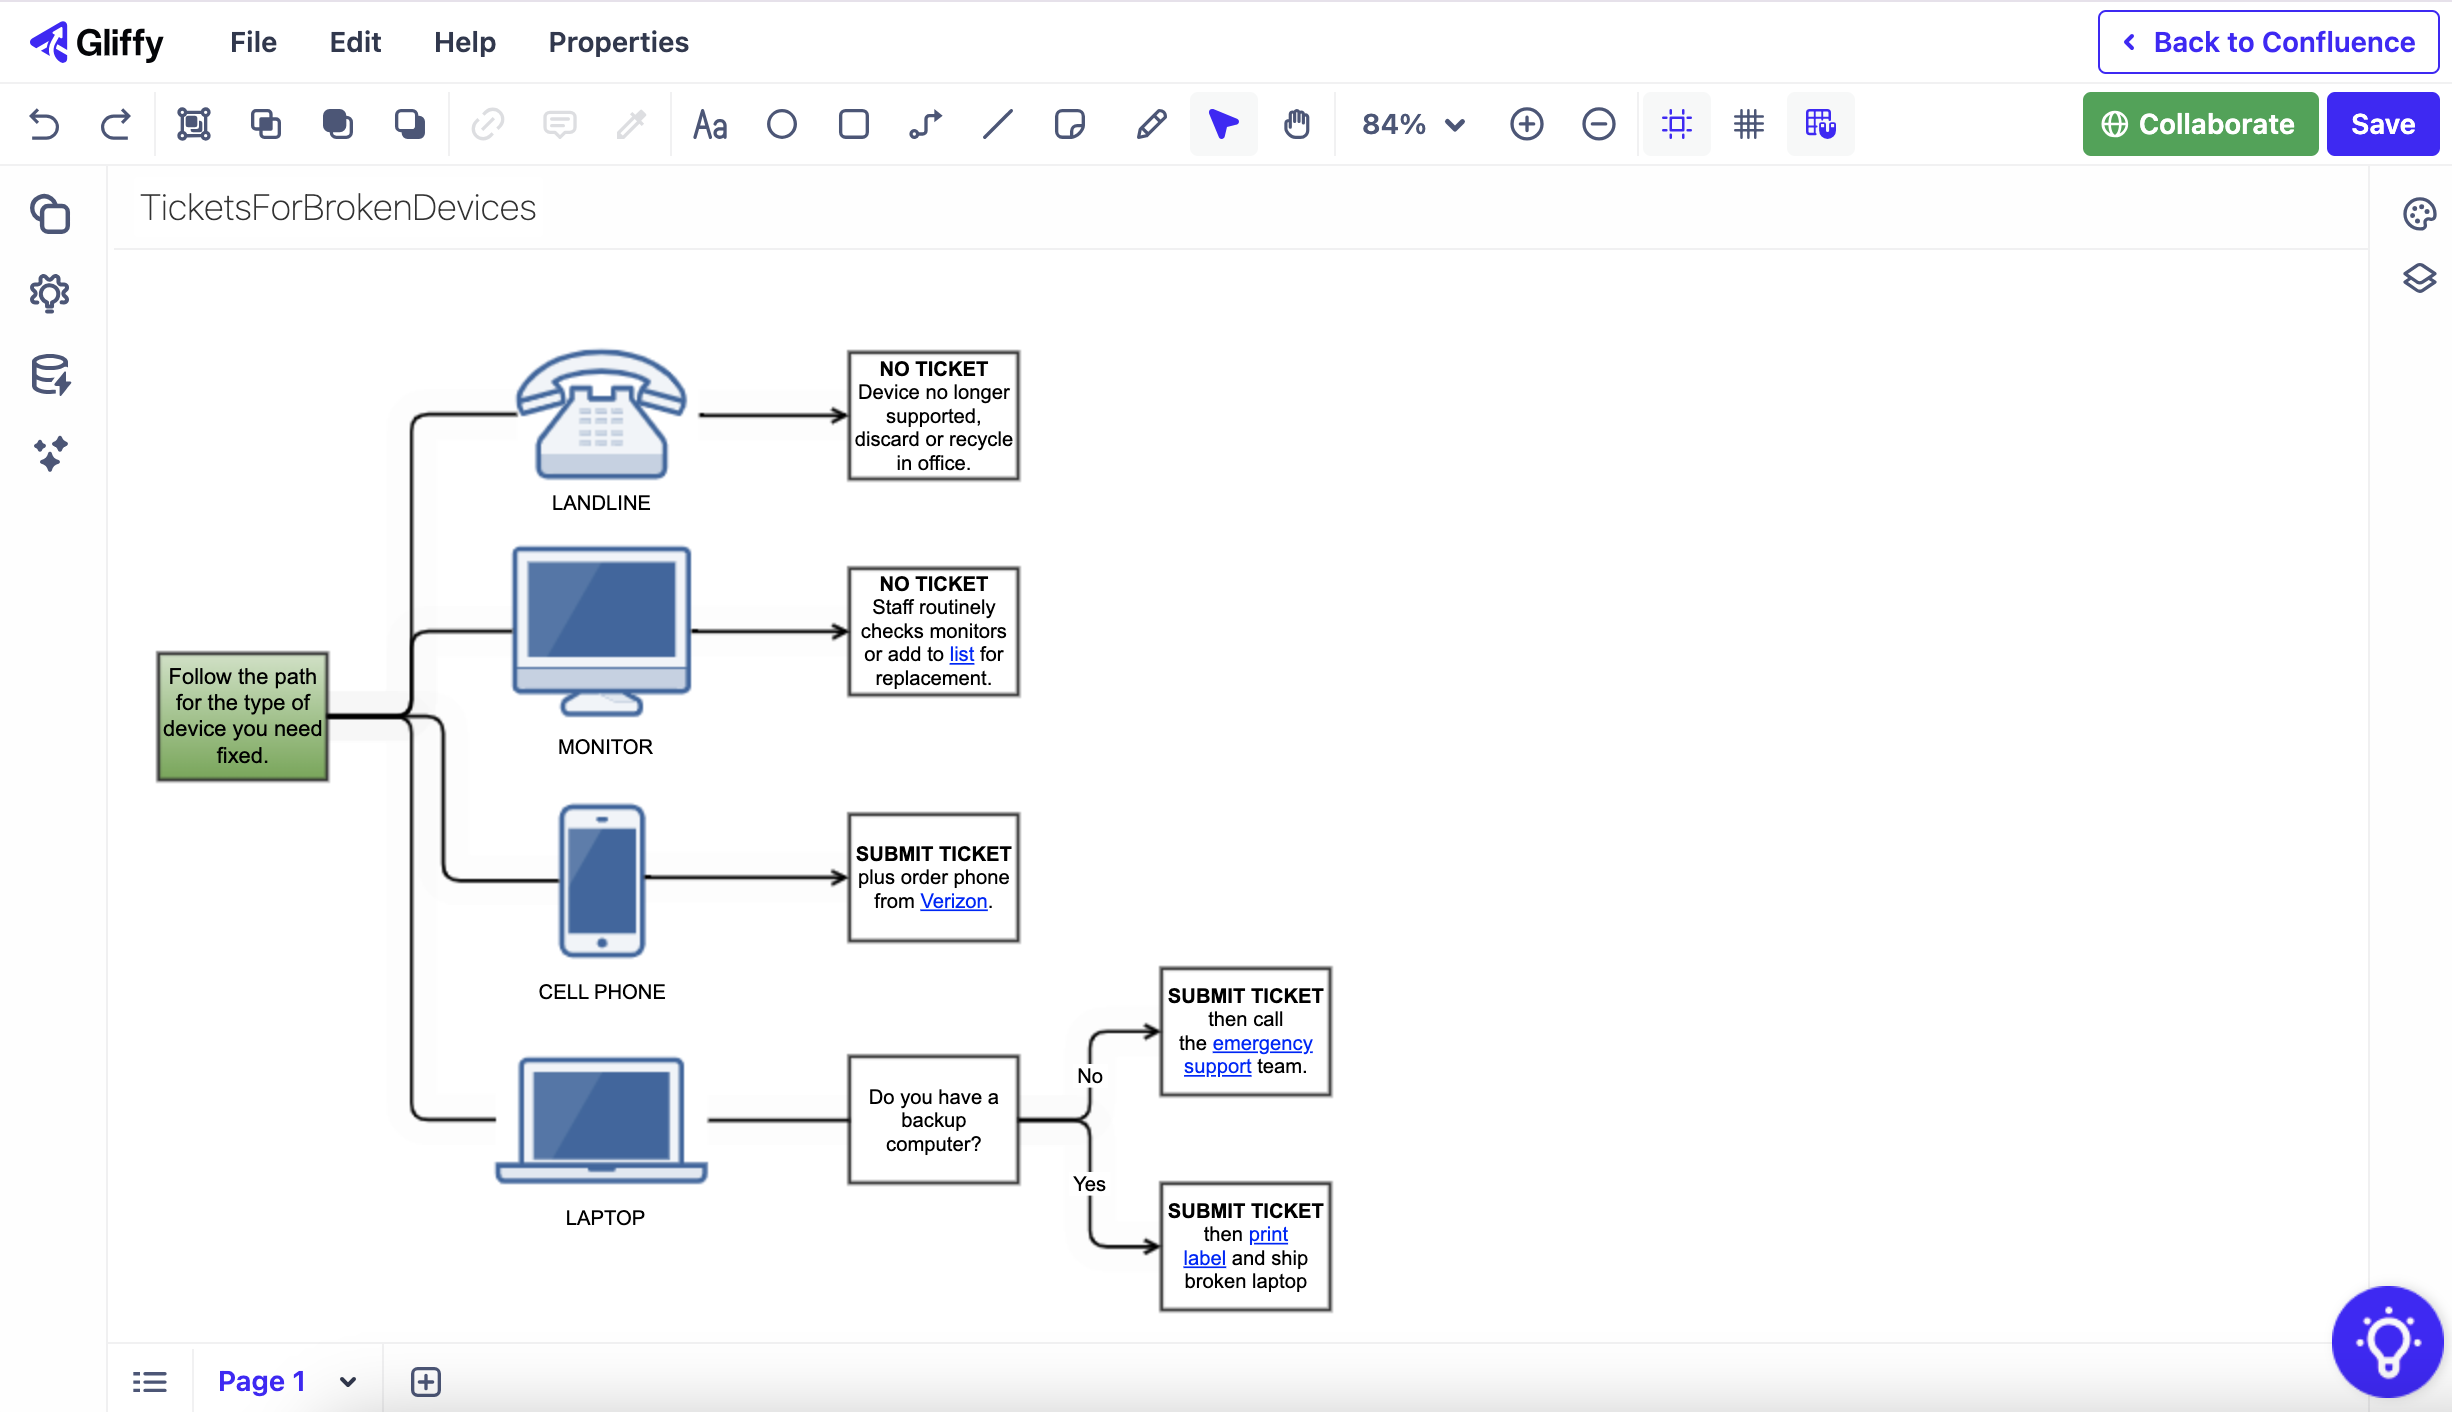
Gliffy helps your team save time searching for information by integrating directly with your service desk.
With an aligned, informed team equipped to handle any issue, customers can be confident they will receive high-quality service in every interaction.
"Great for both brainstorming and documentation of system and software applications. You can do almost anything you would want in terms of building models, diagrams and flows. I use it every day as part of my workflow."
Enhance Knowledge Sharing Across Your Organization
Wherever your organization uses Confluence, Gliffy is there to help each team capture and share knowledge effectively.
Deliver Great Service with Gliffy
How to Start Diagramming Now
Atlassian Users
Learn how to request Gliffy from your organization’s Confluence administrator.