Video Tutorial: How to Draw ERD Diagrams
While there are many ways to visualize the structure of a database, ER diagrams are considered the standardized method of creating a database diagram. Diagrams created in this format are easy to understand at a glance, helping your teammates and other stakeholders quickly grasp the information you want to communicate.
In this 10-minute video tutorial, we’ll cover the importance of ERDs and how to create your own using Gliffy, an intuitive technical diagramming tool for Confluence.
Don’t forget to start your free evaluation of Gliffy before getting started!
What is an Entity-Relationship Diagram?
An entity relationship diagram, also known as an ER diagram or ERD, is a type of flowchart that helps you visualize the structure of a database by showing how its entities relate to and interact with one another.
It is a key tool in database design and data modeling, helping to structure and organize data in a way that reflects real-world processes and relationships.
To learn more about the components of an ERD and see step-by-step directions, keep reading or jump to a section.
Back to topWhy Make an Entity Relationship Diagram?
Any project that requires a clear structuring of data can benefit from an ER diagram. It is a valuable tool for database design and documentation that communicates complex information in a standardized, easy-to-understand format.
There are a few different situations where you might find an ER diagram helpful. These include:
- Documenting existing databases – This exercise can help with more effective troubleshooting and expansion efforts.
- Designing a new database – ERDs can help you organize your ideas during the requirements-gathering stage, gain stakeholder approval, and ensure that there are no flaws in your design before you begin to build.
Whether your database contains customer data, data gathered from research, or any other type of information, an entity relationship diagram is your number one tool as you work to keep it all in order.
Back to topWhat Are the Components of an ER Diagram?
Entity relationship diagrams are made up of entities, attributes, relationships, and lines of cardinality. These standardized types of shapes and connectors make it easy for viewers unfamiliar with your database to understand your diagram.
Entities
Entities are the foundation of an entity relationship diagram. They are considered the “nouns” of your diagram and are typically represented by rectangles.
In some scenarios, entities within a diagram can belong to different types, sets, or categories, which further describe certain details about each entity.
Attributes
Attributes are properties of entities that further describe the data that the entity includes.
In some cases, attributes are listed within the rectangle representing the entity, under the entity name. In other cases, they are represented by ovals which connect to the entity.
The approach you choose depends on your individual database and the level of detail you wish to express in your diagram.
Relationships
Relationships describe how entities act on one another to perform various tasks. Diamonds represent relationships in an ERD and are considered the “verbs” of your diagram. What does one entity do to another? How is one affected by another? These are the kinds of questions that relationships answer.
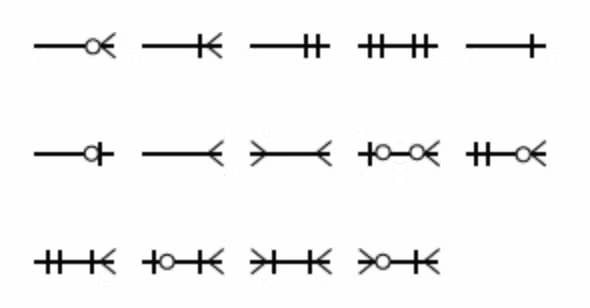
Lines of Cardinality
Lines of cardinality show the numerical values of the relationships between two entities or entity sets. The lines have different types of markings depending on which type of relationship they are showing – although there are many options, the most common type of cardinality is one-to-many, traditionally represented by a crow’s foot line.
Want to learn more about ERD notation? Check out our blog explaining entity relationship diagram symbols.
Back to topHow to Draw an ER Diagram: Step by Step
These basic steps will help you draw an entity relationship diagram anywhere, from a PowerPoint to a piece of paper, but in our example images, we’ll be using Gliffy for Confluence. If you want your diagram to look like ours, start your free evaluation to follow along!
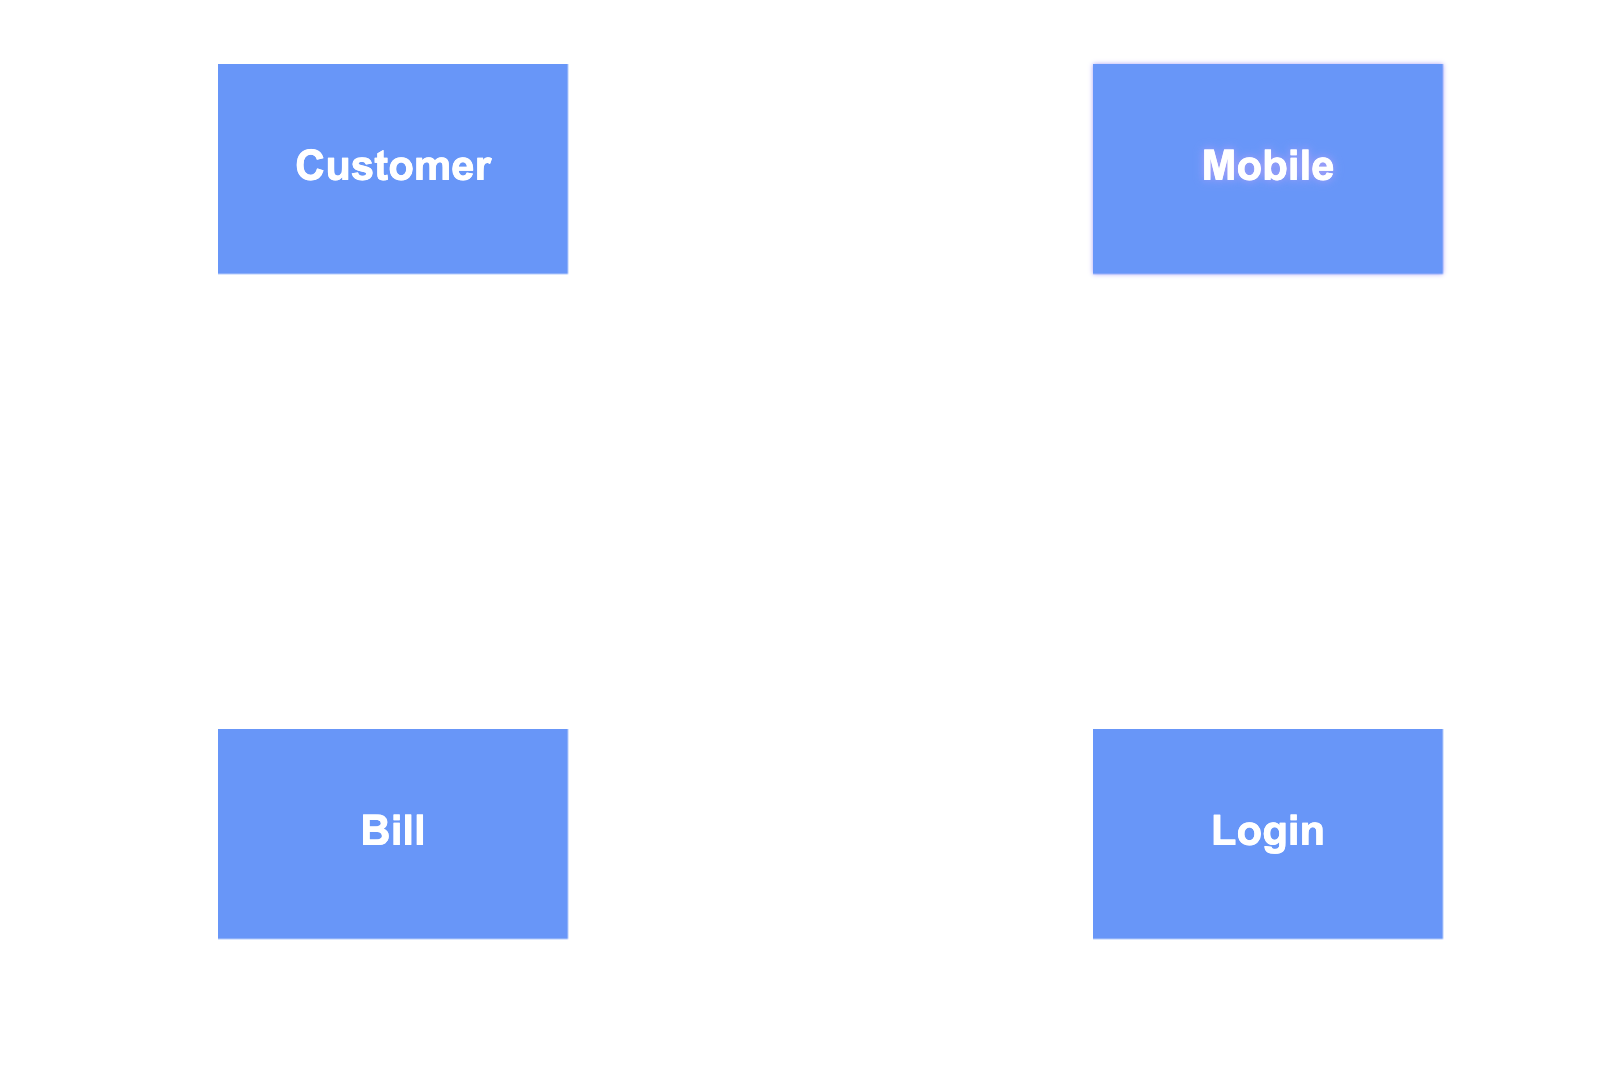
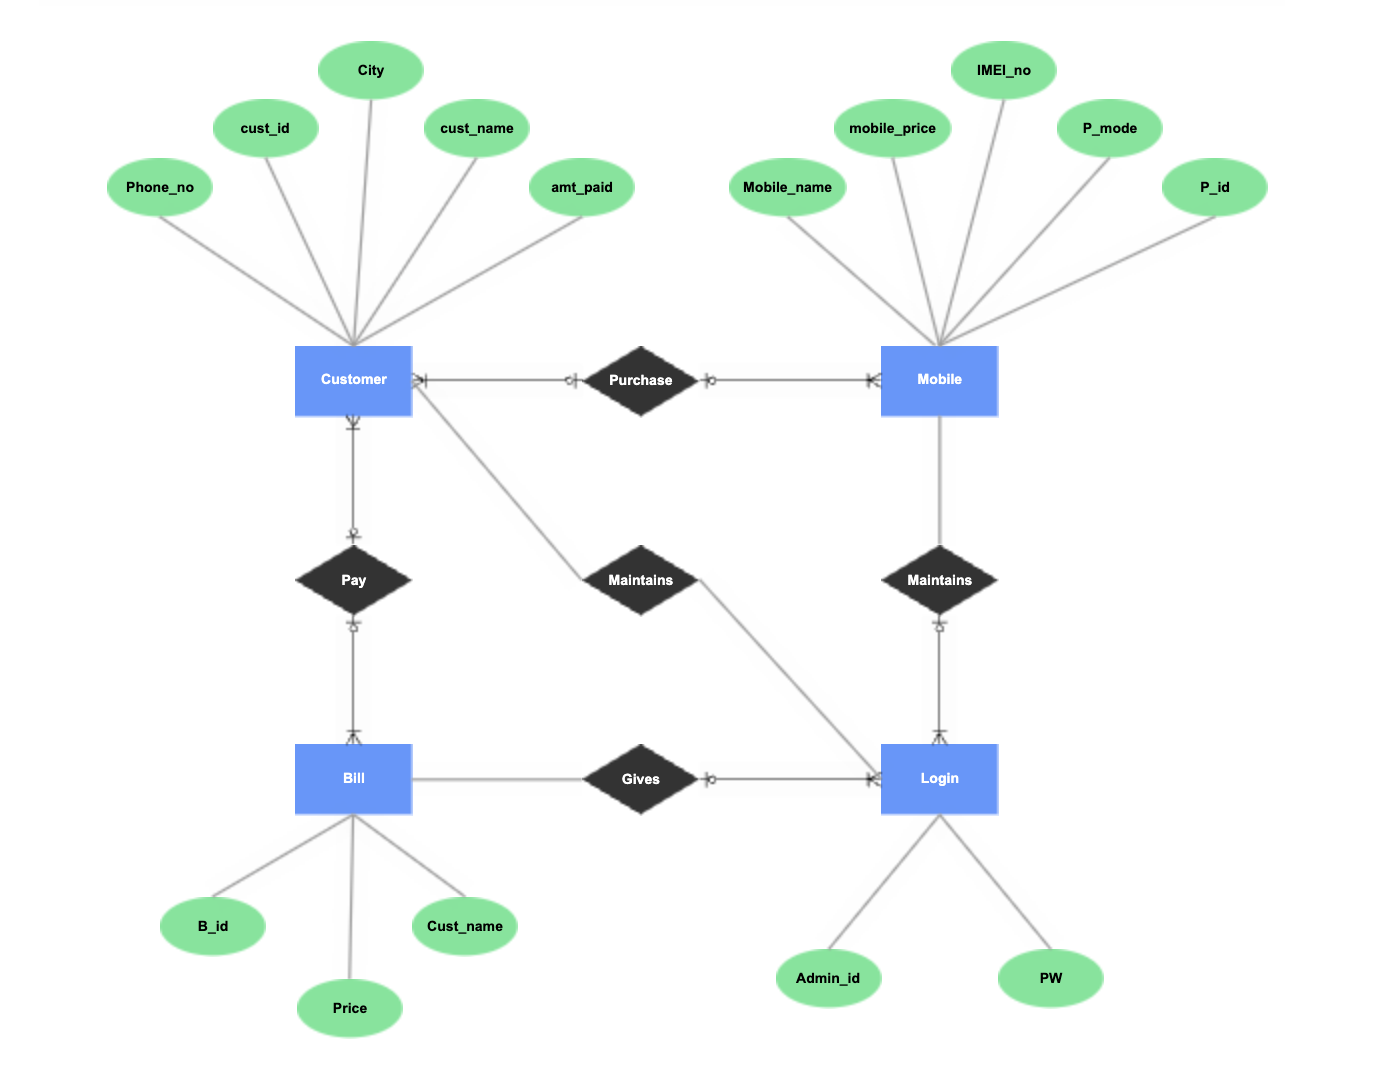
Step 1: Identify Your Database's Entities
Which entities make up your database? Represent each one with a rectangle, and space them apart from each other so you have room to add attributes and relationships to your diagram in the next steps.
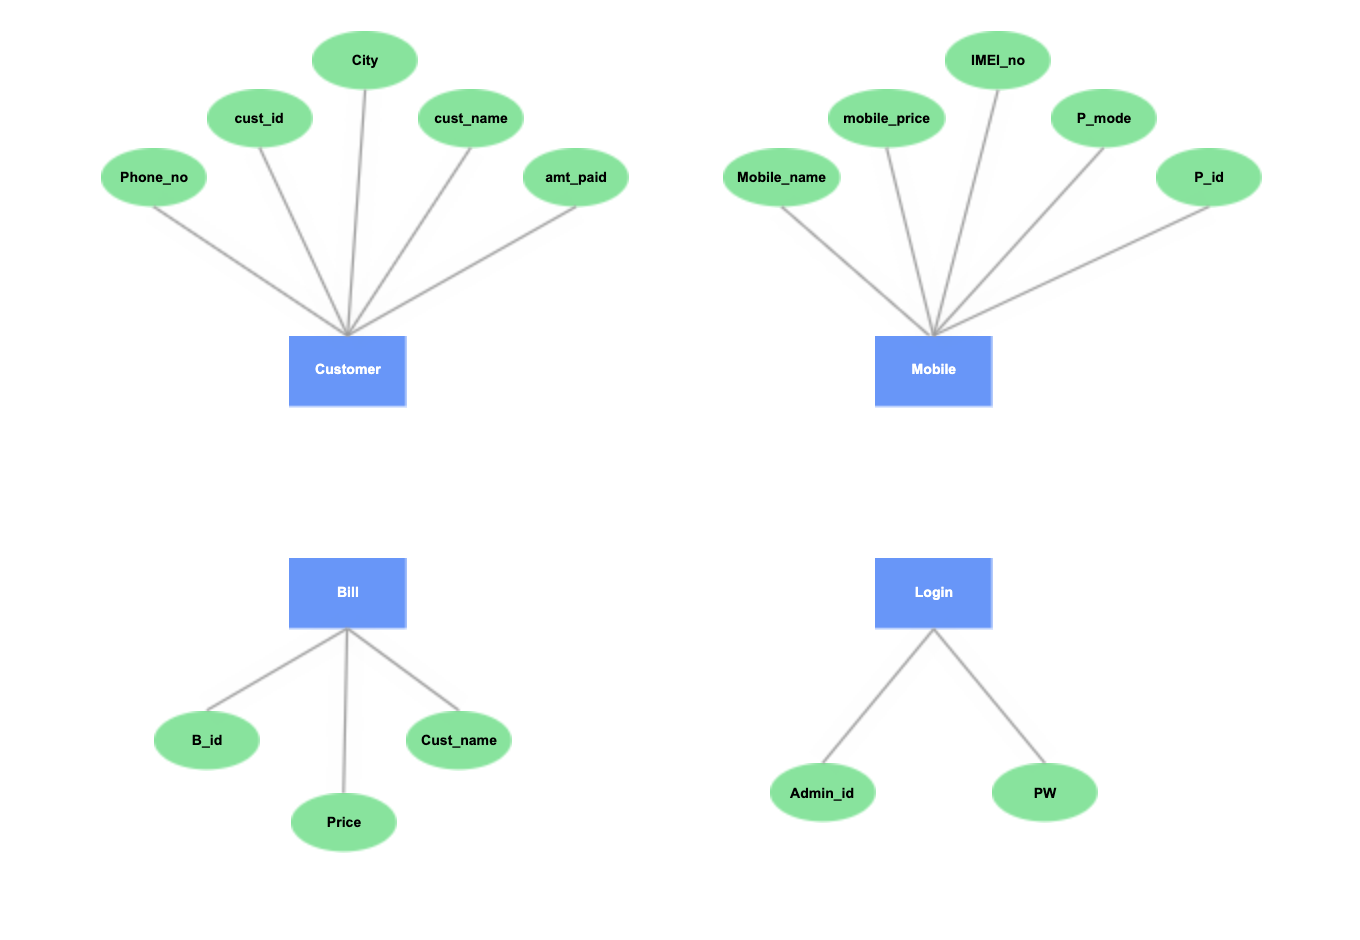
Step 2: Add Attributes to Each Entity
Each entity should have at least one attribute – a group of data that belongs to the entity. Sometimes, attributes are listed below the entity name within the same rectangle, but to make the structure clearer, we’ll represent attributes by drawing and labeling each one inside its own oval.
Then, connect each attribute to its corresponding entity with a solid line.
Step 3: Represent Relationships Between Entities
Think through the relationships, or “verbs,” that occur within your system. The easiest way to do this is to look at each entity and connect it to another by saying, “What does [entity one] do with [entity two]?”
For example, a customer purchases a phone. The cell service creates a bill, and the customer then pays that bill.
Relationships are typically represented by diamonds located in between the two entities that are connected.
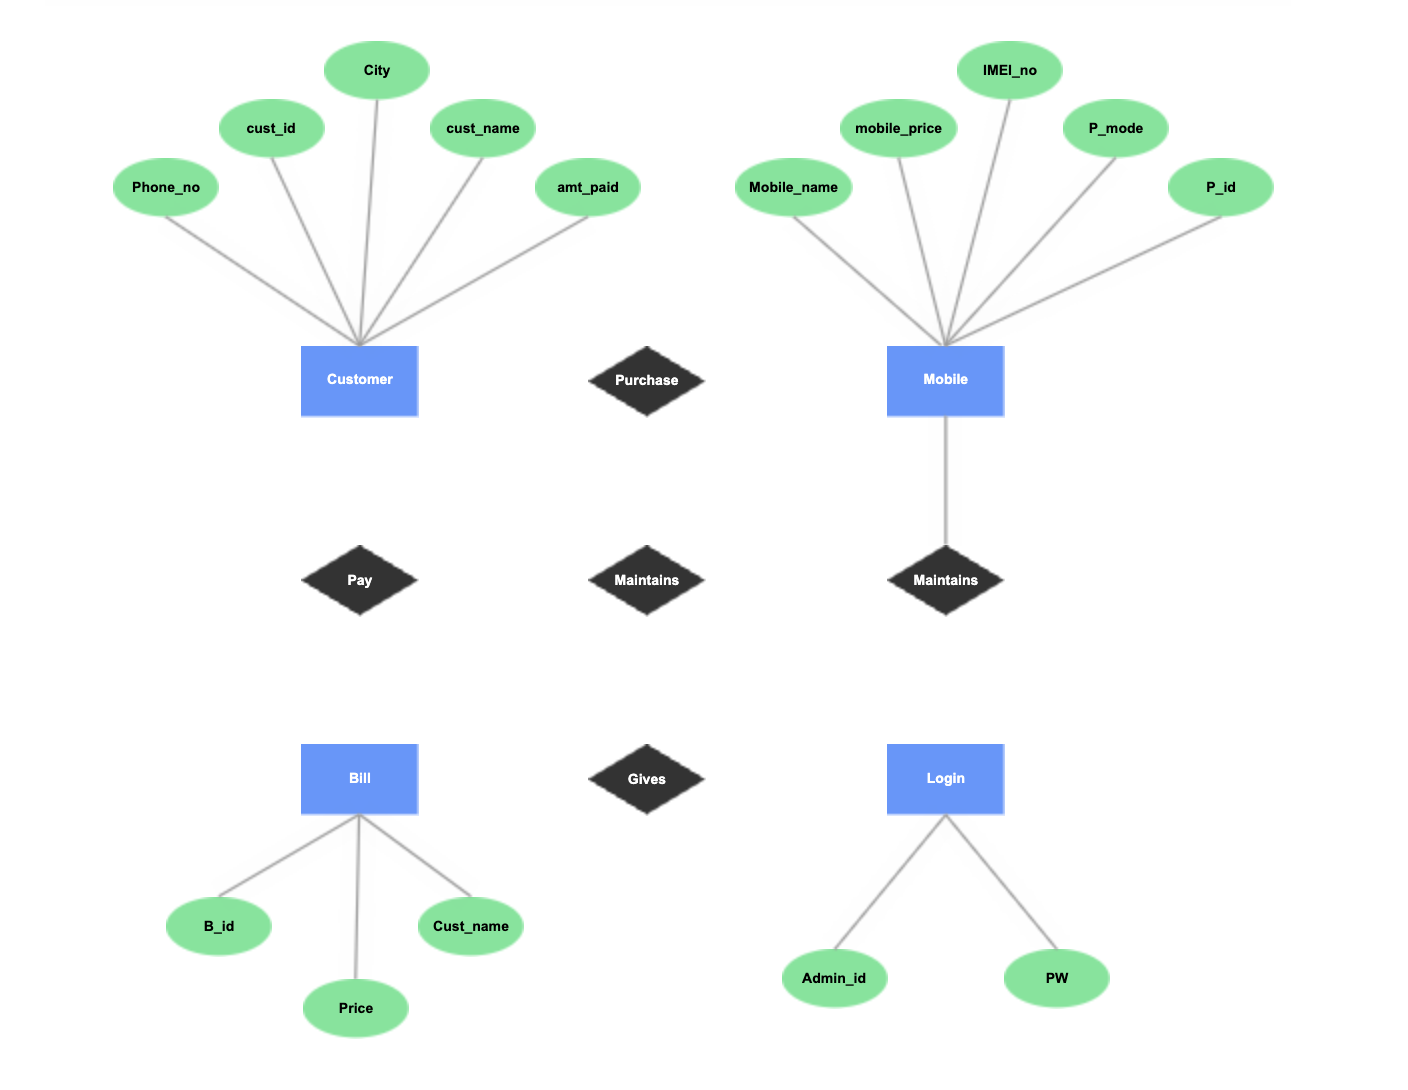
Step 4: Add Cardinality to Every Relationship
The final step to creating a basic ER diagram is to define the amount of data that comes from each entity. This information is described by cardinality – a simple notation that tells your ERD reader at a glance how many connections exist between two connected entities (zero, one, many, or some combination of these).
For example, a customer can purchase one or many phones. The cell service maintains many phones. The customer pays one bill.
Here’s how to represent a few of the most common types of cardinalities that you may include in your diagram:
- One to one: Use a line with a dash on each end.
- One to many: Use a crow’s foot line.
- Many to many: Use a double crow’s foot line
 Back to top
Creating Entity Relationship Diagrams from Code
Don’t have time to create an ERD by dragging and dropping shapes and arrows onto the canvas? With Gliffy, there’s a faster way.
Our Mermaid diagram editor allows you to describe the elements of your ER diagram using text alone, then copy and paste that text into Gliffy to automatically generate a clean, organized diagram.
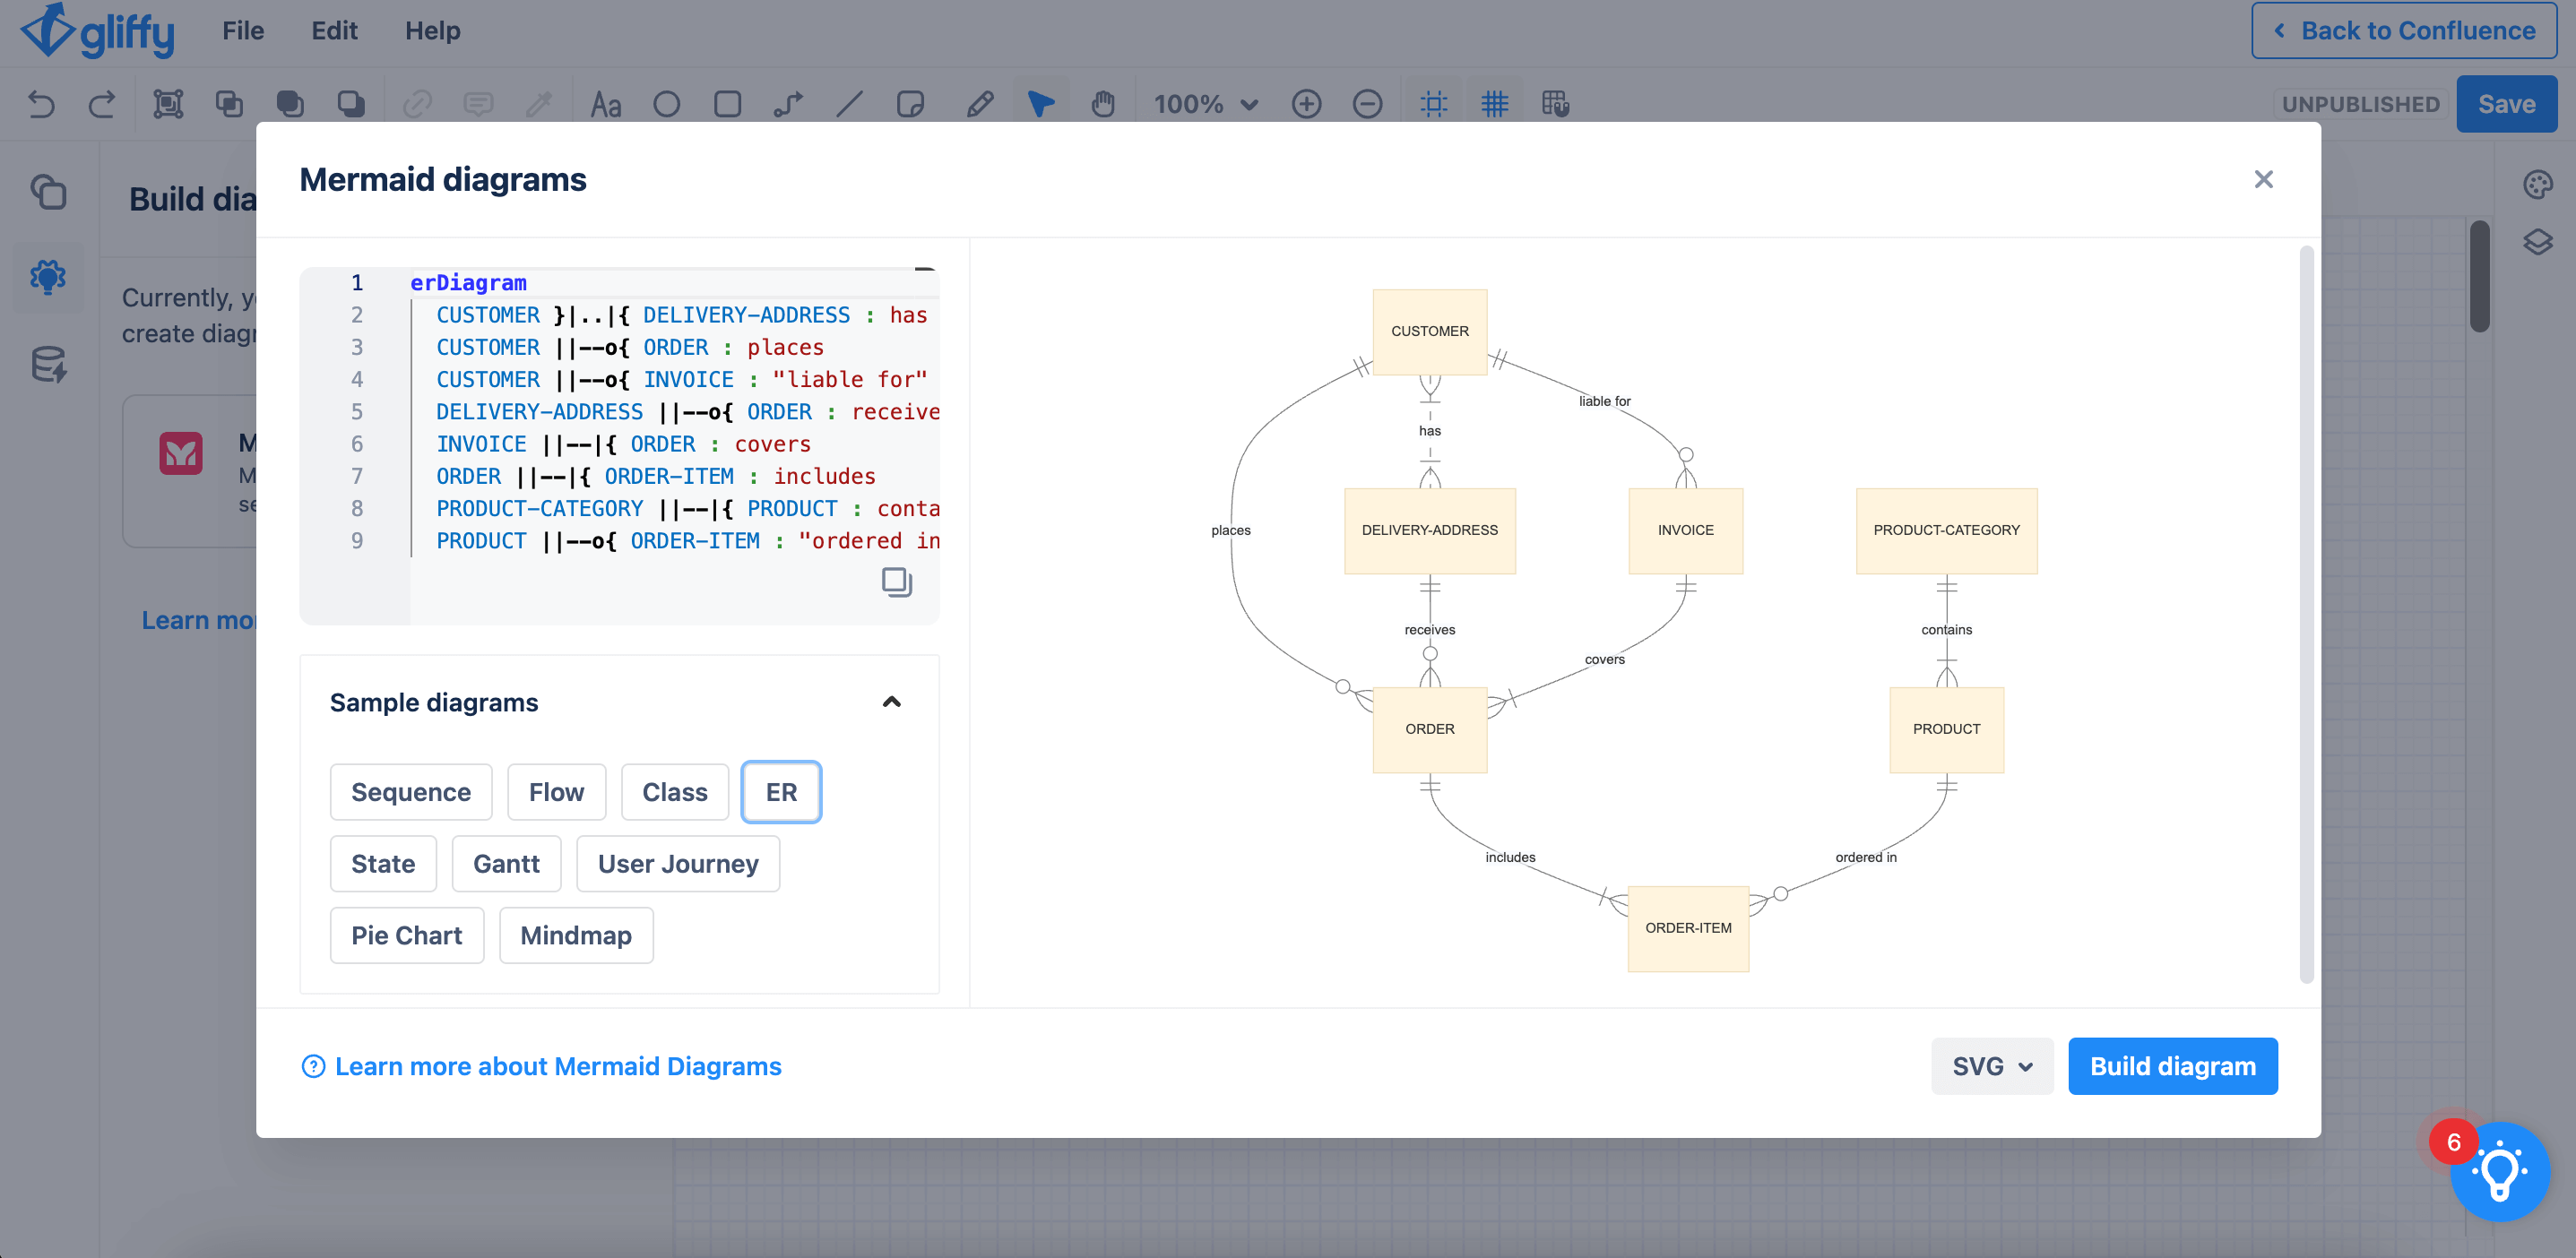
Here’s some sample code to help you get started! (Pro tip: You can also ask ChatGPT to generate Mermaid code for you – just make sure to be specific in your request.)
[erDiagram
    Passenger ||--o{ Booking : "Makes"
    Booking }|..|{ Flight : "Books"
    Airport }|..|{ Flight : "Originates from"
    Airport }|..|{ Flight : "Arrives at"
    Flight }|..|{ Aircraft : "Operated by"
    Aircraft }|..|{ Flight : "Assigned to"

    Passenger {
        int PassengerID
        string FirstName
        string LastName
        string Email
        string PhoneNumber
    }
    Booking {
        int BookingID
        datetime BookingDate
        string SeatNumber
    }
    Airport {
        int AirportCode
        string Name
        string Location
    }
    Flight {
        int FlightNumber
        datetime DepartureTime
        datetime ArrivalTime
    }
    Aircraft {
        int AircraftID
        string Model
        int Capacity
    }

    Passenger }|..|{ Booking : "Books"
    Booking }|..|{ Flight : "Assigned to"
    Airport }|..|{ Flight : "Departure Airport"
    Airport }|..|{ Flight : "Arrival Airport"
Flight }|..|{ Aircraft : "Assigned to"Which Tools Are Best for Creating an ERD Directly in Confluence?
Entity relationship diagrams can be a valuable tool for technical documentation, especially when you need to communicate details about a database to team members or other business stakeholders.
Gliffy makes it easy to visualize your database alongside the rest of your Confluence documentation, making it a true resource for your team. Get started for free today!