A fishbone diagram is a way to visually represent the potential causes of an event or problem. Kaoru Ishikawa created the fishbone diagram structure, so you’ll also see them referred to as Ishikawa diagrams or cause and effect diagrams.
To learn more about fishbone diagrams, read on or jump ahead to one of the following sections:
Want to get started right away? Make an Ishikawa diagram with a free trial of Gliffy:
Back to topWhat is a Fishbone Diagram Used For?
Fishbone diagrams help process designers brainstorm the potential causes for a particular problem as part of process analysis. Brainstorming everything that could cause a process to fail helps process owners manage existing processes, but can be even more effective while designing a new process. By considering what can go wrong, designers can strengthen each step or adjust the process to be as efficient and reliable as possible.
Because fishbone diagrams work by identifying possible issues and failures, they’re especially valuable in fields like supply chain management and manufacturing. Manufacturers need to ensure that their output is consistent and predictable, so understanding what could cause variation will help them create better processes.
Get started with a free trial of Gliffy to make your own fishbone diagram >>
Back to topHow to Use an Ishikawa Diagram for Root Cause Analysis
What is Root Cause Analysis?
The American Society for Quality defines root cause analysis (RCA) as “the method of uncovering the accurate reason(s) why something is happening or has already occurred.” RCA uses several techniques to identify causes and is part of the field of total quality management. RCA is often used to understand system failures or near-misses.
Step 1: Assemble Your Team and Identify the Problem
The first step to brainstorming causes with an Ishikawa diagram is pulling together a cross-functional team to address the failure or problem with multiple areas of expertise. Once you have representation from multiple roles or impacted areas of your business, you can brief everyone on the challenge and get started.
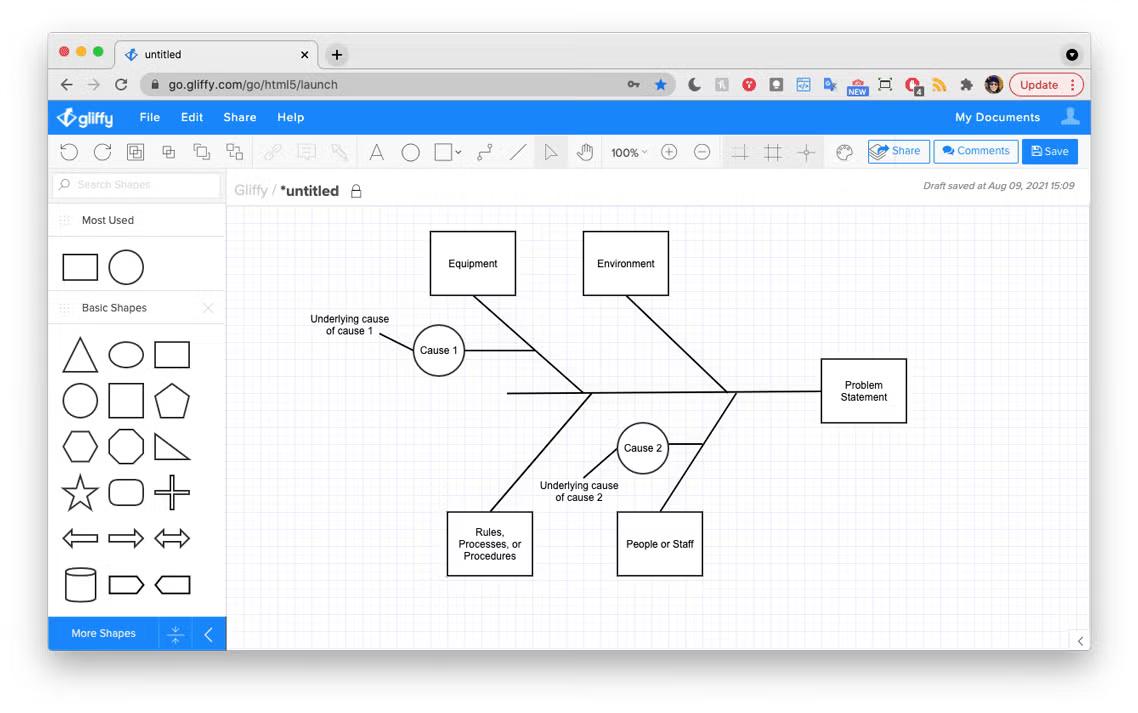
Identify and agree upon a clear problem statement that aligns everyone around the failure or issue they need to address. This problem statement goes at the “head” of the fish. Examples of problem statements could be:
- Quality check has found three times more faulty products in the past two months compared to the previous period.
- An uncredentialed person accessed the production facility, contaminating several batches of our product.
- A patient was given a dose of a medicine they reported being allergic to, causing them to experience a medical emergency.
Step 2: Identify the Potential Factors Causing the Problem
Second, consider what types of factors could have contributed to the problem. These should be broad categories to guide brainstorming, such as Equipment, Environment, Rules/Procedures, and Staff/People.
Some teams use “the 6 Ms” as these categories: Manpower, Material, Method, Mother Nature, Machine, and Measurement. Depending on the situation you’re investigating or your business model, these categories may fit perfectly or they may not resonate. Feel free to edit the categories as needed for your business, but be careful not to exclude anything that may have contributed to your issue.
These categories become the “bones” of your fishbone diagram.
Step 3: Brainstorm Specific Causes Within Each Factor
Next, brainstorm specific causes that may occur or identify things that occurred within each of the categories your team defined. For a Manpower or People category, you may identify that an employee skipped a step or that there was no manager available to approve the product at a certain step in the process. For an Equipment or Machine category, you may identify an equipment failure.
These causes can be listed in your diagram by connecting them to the “bone” of the factor they fall under.
Step 4: Ask "Why" for Each Cause
Often, the initial causes you identify are actually symptomatic or a secondary cause of a deeper issue. In order to understand the deeper cause, use the 5 Whys brainstorming technique to ask “Why?” several times within your brainstorming session.
For example, if you identify that an employee skipped a critical step in your process, ask what contributed to them skipping that step. They may have referenced outdated documentation and used an old process instead.
Then, you’d want to jump back to the “Method” or “Rules/Procedures” factor and also add that the documentation is inconsistent throughout your facility or onboarding process. Asking “why?” for that cause, you might identify that there is no process to regularly update documentation or that a certain resource is left out of your update process.
For each deeper cause identified, they can be listed in the diagram as an offshoot or a smaller “fishbone”.
Step 5: Investigate, Evaluate, and Correct Causes
Once your team has brainstormed and identified several potential root causes, it’s time to evaluate whether those causes actually impact output or cause a problem. With an understanding of which causes are affecting your process, you can create plans to further investigate or correct them.
Back to topHow to Draw a Fishbone Diagram
Drawing a fishbone diagram in Gliffy is easy. Make sure you’re signed up for a free trial in Gliffy for Confluence, then you can follow along with these steps.
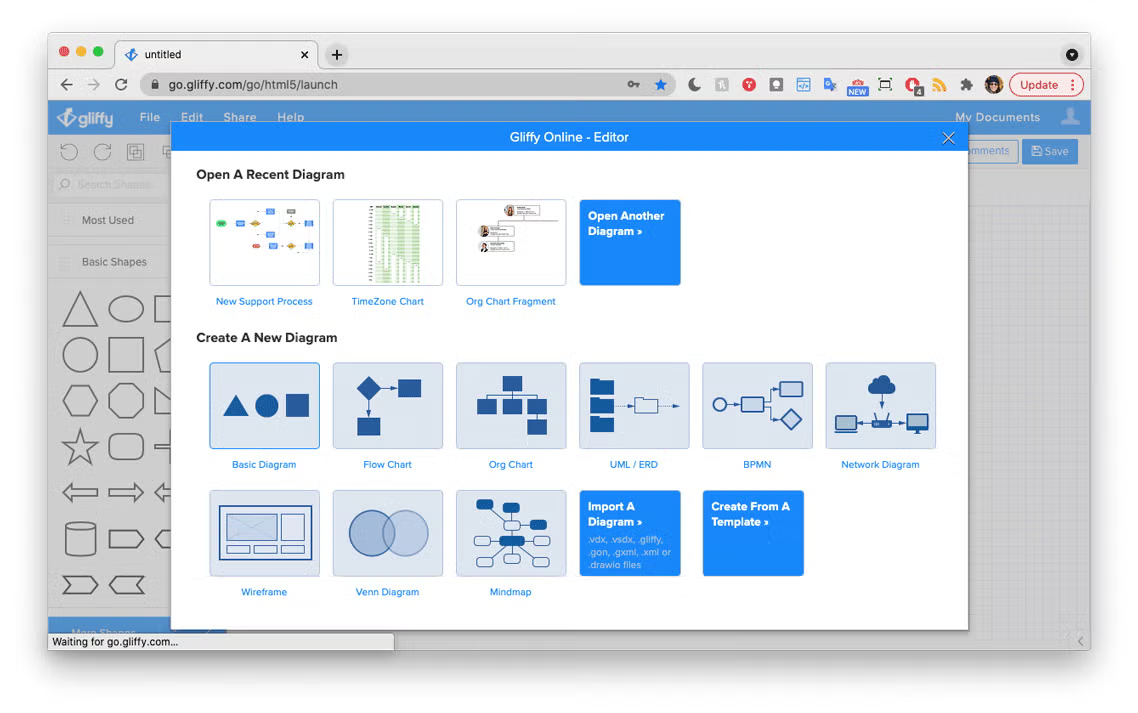
1. Start with a Basic Diagram
This pre-loads a basic set of shapes that you can use to brainstorm ideas.
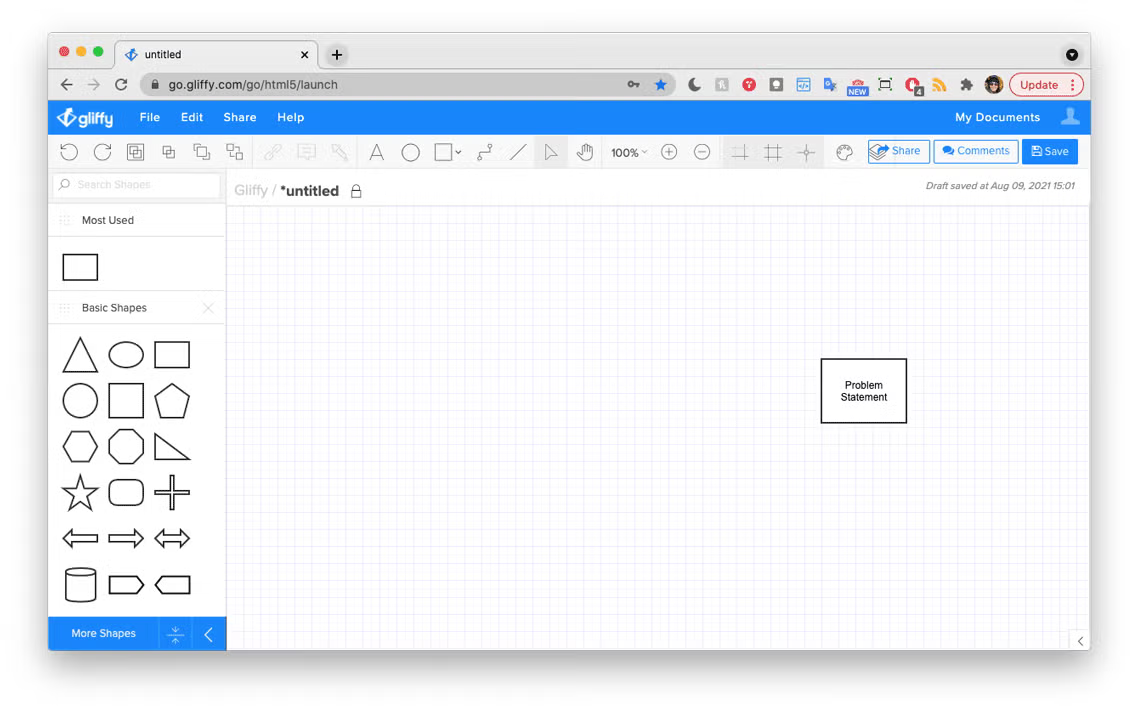
2. Drag and Drop a Rectangle for the Problem Statement
Click on the rectangle from the basic shapes panel, then drag and drop it onto the right side of your diagram. Then, just type to add your problem statement to the rectangle.
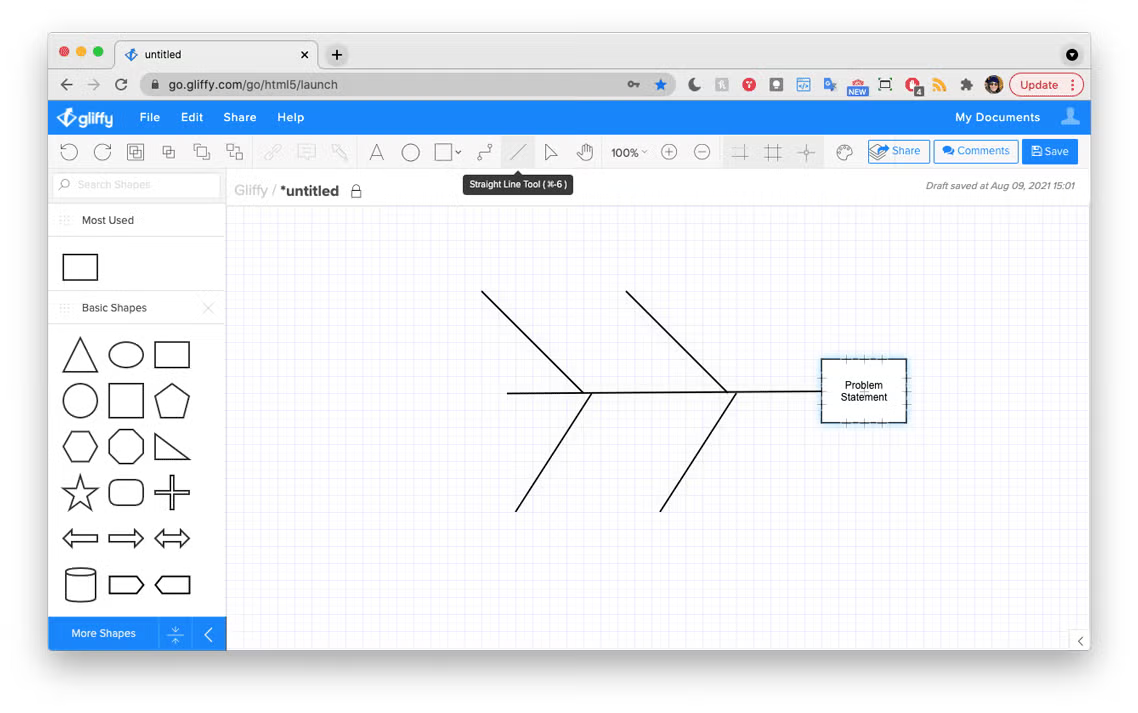
3. Use the Line Tool to Draw the Structure of the Diagram
Find the line tool from the toolbar at the top of the diagram editor, next to the cursor icon. Then, click and drag to create the lines that become the “bones” of the diagram.
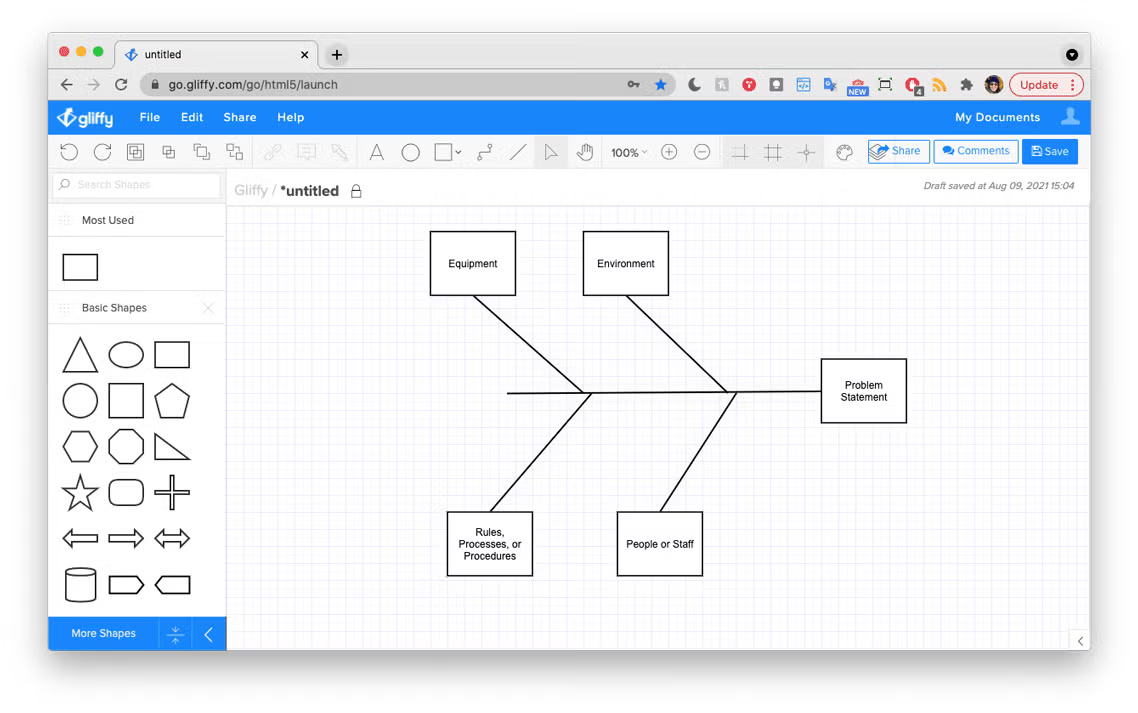
4. Add Factors to the Ends of Each Line
Drag and drop more rectangles onto your diagram, typing to label them as you go. These are the factors that you’ll consider during your brainstorm.
5. Brainstorm and Add Causes to Your Diagram
With your structure set up, you can start brainstorming causes. Use the text tool to add causes outside of a shape, or you can choose a different shape to keep your diagram organized.
Tip: to add extra detail or longer descriptions to your diagram, check out the pop-up notes tool.
6. Save and Share Your Diagram
Save your diagram and use the share button to create an always-updated link to your diagram. When you make tweaks or changes to the base diagram, viewers will always see the most recent version.
Back to topPros and Cons of Fishbone Diagrams
When it comes to diagramming, there are clear advantages to using fishbone diagrams as well as some pitfalls to watch out for.
Advantages of Fishbone Diagramming
The primary reason to use an Ishikawa diagram is because it facilitates brainstorming among multiple members of an organization. If an organization doesn’t understand or can’t identify the underlying cause of a problem, they may ask multiple subject matter experts to explore the issue. In this case, using a fishbone or Ishikawa diagram is a great way to structure their exploration and give every expert a way to structure their feedback and ideas.
Sometimes, there may be multiple causes for a particular issue. Without doing a divergent thinking exercise, process managers may identify a single cause and pour all their resources into addressing it. The cause they identify may not even be the largest contributor to the problem. For that reason, taking a broad thinking approach before targeting a specific cause is a good place to start.
Disadvantages of Fishbone Diagramming
On the other hand, divergent thinking or brainstorming can identify many potential causes for a problem without factoring in which are most impactful. Pursuing solutions to six small causes may not be as effective as identifying one major cause. It’s important to be mindful of time spent on brainstorming and evaluate the output for your brainstorm to identify which causes are most relevant or impactful before putting your project into action.
The other disadvantage of Ishikawa diagrams is that they are not necessarily evidence-based. When you bring in a cross-functional team to brainstorm, they may have biases against other departments or teams within your organization that make them more likely to suggest certain causes.
For example, a Quality Manager who didn’t work well with an Application Engineer on a previous project may be focused on causes stemming from the AE’s work, rather than looking for potential causes within their own workflow. As you brainstorm, encourage your team to use evidence — not just opinion — to identify causes.
Back to topMake an Ishikawa Diagram or Create Fishbone Diagrams in Gliffy
With Gliffy, diagramming is as simple as drag and drop. Start your free trial and try using Gliffy to make an Ishikawa diagram or fishbone diagram today.