UML (Unified Modeling Language) diagrams are the standard for software developers and engineers to communicate about a system’s structure and behavior without getting into the actual code.
UML diagram types vary in which aspect of a system they depict, but they fall into three categories—structure, behavioral, and interaction.
In this blog, we’ll focus on the general steps you need to know to get started on any UML diagram.
Back to topYou can learn more about Unified Modeling Language in general and about all fourteen UML diagram types in our other UML resources.
Video Tutorial: Creating UML Diagrams
In this video, we’ll cover the process of creating a UML diagram from start to finish in Gliffy.
How to Draw a UML Diagram
1. Visualize Your System with UML Shapes
Shapes are the building blocks of your UML diagram, and with Gliffy, you don’t need to upload them yourself—they are all built into Gliffy's shape libraries.
Some examples of UML shapes include:
- Classes: The central objects in a system.
- Components: Any entity that executes functions.
- Packages: Groups of multiple related elements in the system (can include multiple components).
- Activities: Symbols that represent activities in a process.
The types of shapes you will need for your diagram depend on the specific type of UML diagram you are creating (e.g. sequence diagrams, class diagrams, component diagrams).
Note: If you don’t see UML shapes in the Shapes panel when you open Gliffy, you can add them by clicking “More Shapes” in the bottom left-hand corner of your screen.
2. Show Connections with UML Connectors
While shapes form your system’s structure, you will need connectors to show how it operates. Some examples of UML connectors include:
- Interactions: Connections or relationships between objects.
- Dependencies: One action or object relies on another.
- Messages: Communications between objects.
Connectors might look like solid lines, dotted lines, arrows, or lines containing symbols. Similar to shapes, the type of connector you will need depends on the type of diagram you’re creating and the type of system you’re visualizing.
3. Add Layers for Extra Detail
Once you have your UML objects and connectors placed, you can add extra detail to your diagram to help the viewer better understand the flow of information.
One example of this is adding interactive layers.
With Gliffy, you can create a UML diagram that users can modify when they view it on a Confluence page, revealing or hiding information based on the level of context they need.
This makes your diagram a resource you can share with any stakeholder, regardless of their level of technical expertise.
Back to top3 Methods for Creating UML Diagrams
Create UML Diagrams from a Template
Gliffy offers a wide variety of UML diagram templates to help you get started. With these templates, you’ll get all the shapes and connectors you need right away, so you can save time by simply customizing your diagram rather than creating it from scratch.
How to Use Templates in Gliffy
Create UML Diagrams with Code
While it’s simple to create UML diagrams with Gliffy by dragging and dropping shapes onto the canvas, it can also be a time-consuming process, especially if you are visualizing a complex system.
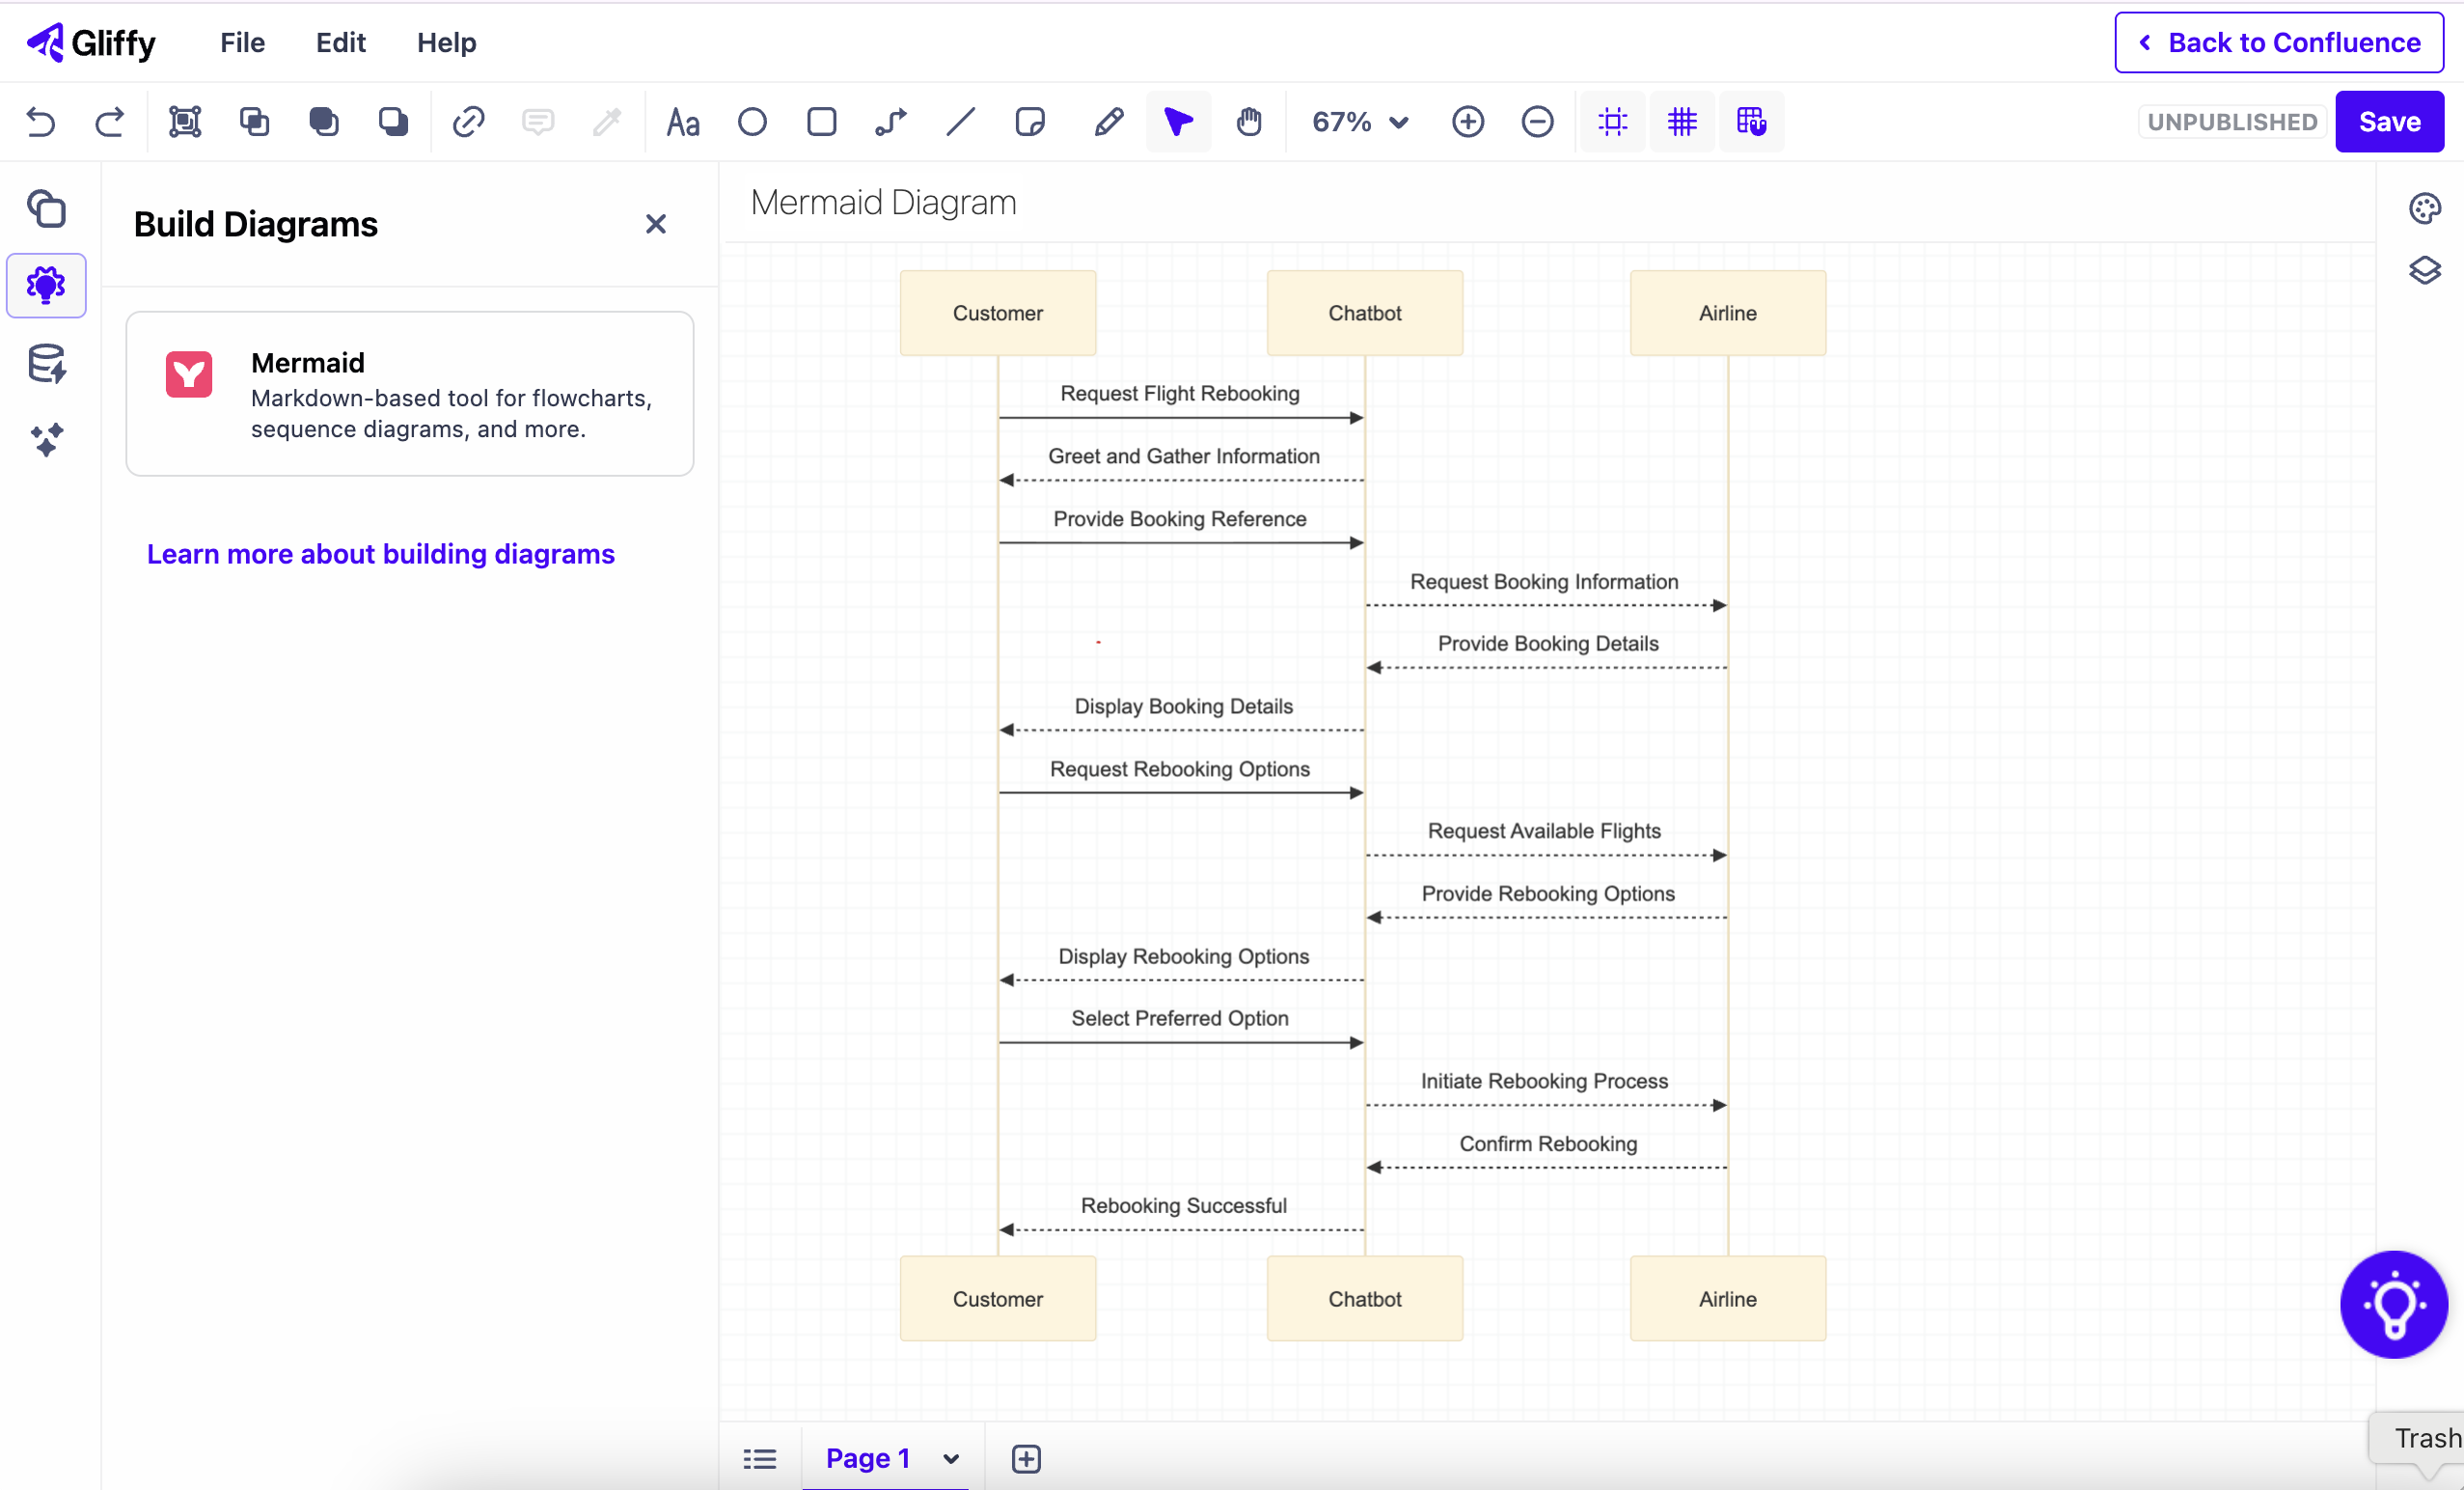
That’s where Mermaid comes in.
Mermaid, a form of diagramming with code, uses Markdown-inspired text definitions that are easy to write and modify. This means that developers and engineers can save time by using their keyboard alone to create a diagram from start to finish.
Create UML Diagrams with AI
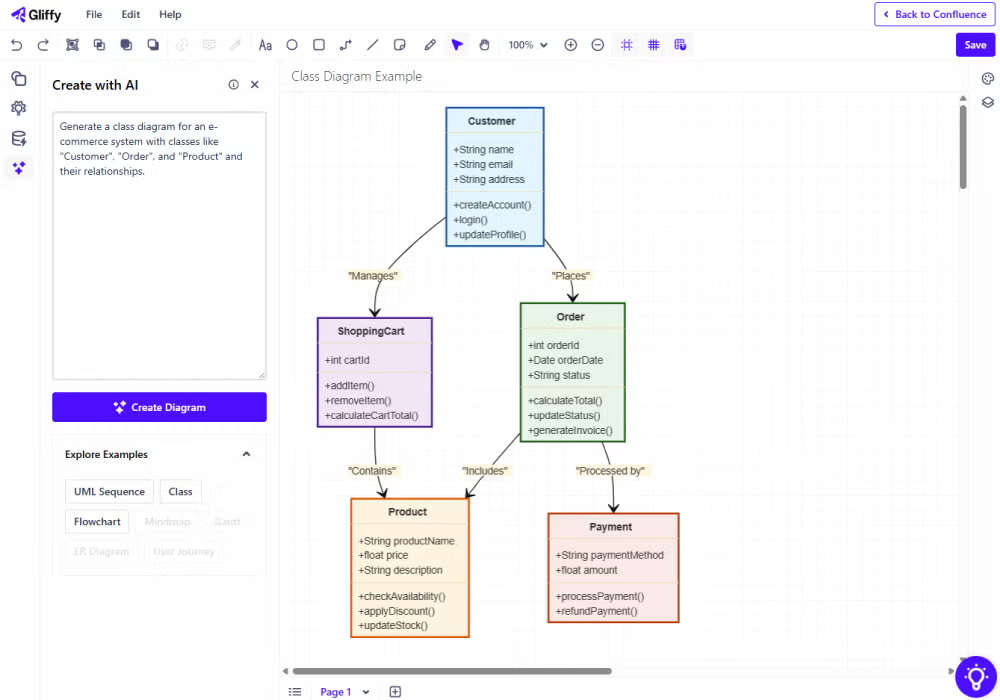
If you aren’t familiar with Mermaid markdown, Gliffy’s Create with AI feature is an equally fast way to generate UML diagrams.
Even non-technical users can create UML diagrams quickly—and with proper notation—by describing what they want to create in plain language. This level of technicality goes beyond the ability of AI diagram generation in Confluence’s built-in whiteboarding functionality.
 Back to top
Draw UML Diagrams Directly in Confluence
UML diagrams make your technical documentation easier to understand, faster to read, and more engaging for your teammates.
In fact, Atlassian’s own research shows that Confluence pages with visual elements are nearly 2 times as likely to be read than pages that contain only text.
To make complex information more accessible, and do it as quickly and efficiently as possible, try Gliffy Diagrams for Confluence today. It’s free for 30 days on the Atlassian Marketplace.