Application programming interfaces (APIs) are a crucial part of how many businesses build out their functionality, but planning for them can be challenging. An API-first architecture lets you create efficient, modular ecosystems. One of the best ways to implement this strategy is by starting with an API diagram.
Back to topWhat is an API Diagram?
An API diagram documents the routines and protocols of an API to clarify its structure and behavior. API diagrams are helpful because they quickly show both developers and non-technical stakeholders like product managers understand how the system will behave.
Making an API diagram means that you have to be mindful of the flow of your product. You're aiming to create core functionality that's easy to build on for those outside of your system, so planning an API-first approach is about more than just code. It's about structuring your project to make it as practical as possible.
While there are many ways to approach building an API-first project, you should never overlook diagramming as an API management tool, no matter what you're trying to build. The process of creating an API diagram for your API-first project will help you brainstorm, finalize, and streamline how you build your software.
Back to topWhy Make an API Diagram?
When you're building software or designing an API, diagramming is a powerful tool. It helps you be efficient and clear, and can save you time down the line because it allows you to visualize exactly what's happening in your system without having to build them first.
To be truly API-first, you must be highly organized. This helps users get the data they need, while allowing developers to work more efficiently. You want to be able to build out your own product with smooth internal API functionality while allowing your APIs to be easily accessible to other developers.
This means planning out the internal structure of your API well before building it. Because of the number of responses to a call, charting how your API will respond to a given scenario is most easily done visually. You can clarify exactly what happens every time a successful call happens and every time it returns an error.
It also means making your API accessible to other developers. And while an informational article and a little legwork on the developer's part might be enough, arranging that same information in a diagram makes it much easier to understandable and implement.
Diagramming can help with the foundational work for your product, and it can also help you build an easily replicable process for maintenance and further development. Want to dive right in? Get started in minutes by starting your free trial of Gliffy:
Back to topExample API Architecture Diagram + Tips for Getting Started
Once you've brainstormed the basics of your API — what its function is and the information it needs to recall — you'll want to build or streamline your product in a way that will provide maximum benefit to everyone. Other developers should be able to easily take what they need, and you should be able to easily develop and maintain it.
Before writing a single line of code, think about this:
- What calls are you using for each API?
- What order do they go in?
- What will others need from your API to integrate?
- How can you make it as simple as possible for them to access?
These types of questions should be answered to the fullest extent possible, especially if you're working on an early stage product. Resist the temptation to dive right into coding and instead, use a diagram to plot out how all the pieces fit together first.
As soon as you consider all the possible responses to calls on your API, writing a list of options becomes inefficient and messy. With the heightened complexity, visual plotting truly is the easiest way to plan. Take FullContact's diagram of their Person API as an example:
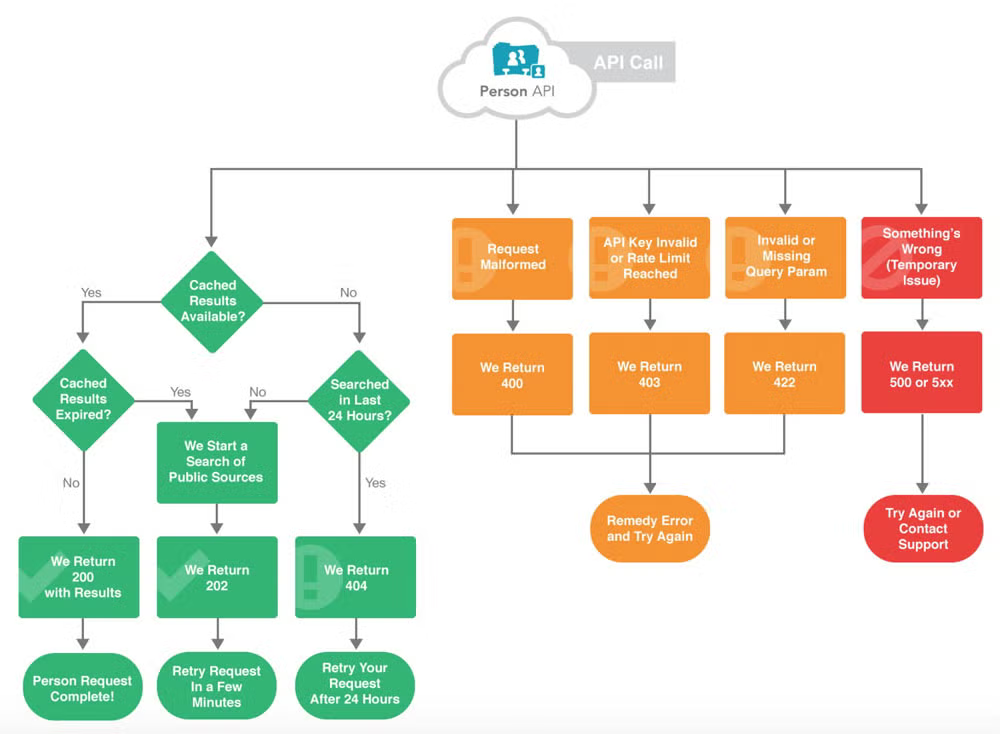
If everything works out, the path to the far left occurs. Simple. But, the devs at FullContact know that this doesn't always happen. Requests are malformed, requiring a 400 bad request status code return. People reach their key limit, requiring a 403 forbidden status code return.
Even when the request is valid, there is still the internal logic of the API to consider. Here FullContact checks for cached results and returns differently depending on recent searches. There are dozens of possible outcomes from an API call. Diagramming lets you easily visualize all responses so you can start planning the code for each.
The mentality of API-first demands that you bring together different dev teams to align on these points before you move too fast and end up in a soup of production that is being pushed out without proper organization.
Back to topUse UML for API Diagramming
Once you've done all the prep work, it's time to start diagramming. This is where you'll make micro-level decisions where you'll solidify how things are labeled and what attributes they have — all the things that finalize how you write your API and how it runs.
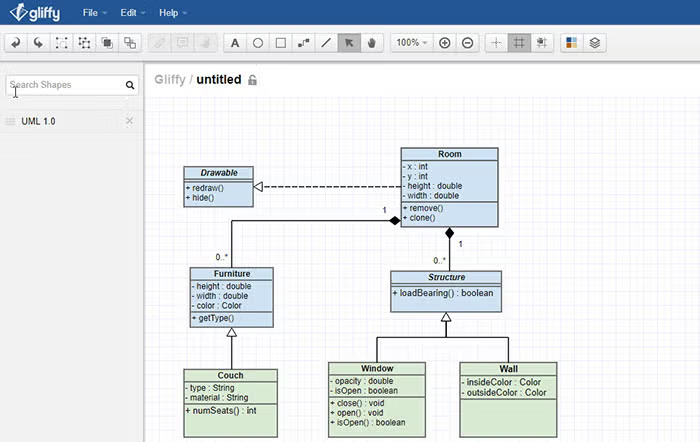
One common way to represent an API or complex software structures is with unified modeling language (UML) diagrams. UML diagrams allow you to plot the relationship between objects, and to specify attributes or code snippets that will go along with those objects. They also allow you to plan or expose behavioral functions of your software. Here's a basic example of a UML chart from our article on creating a UML diagram:
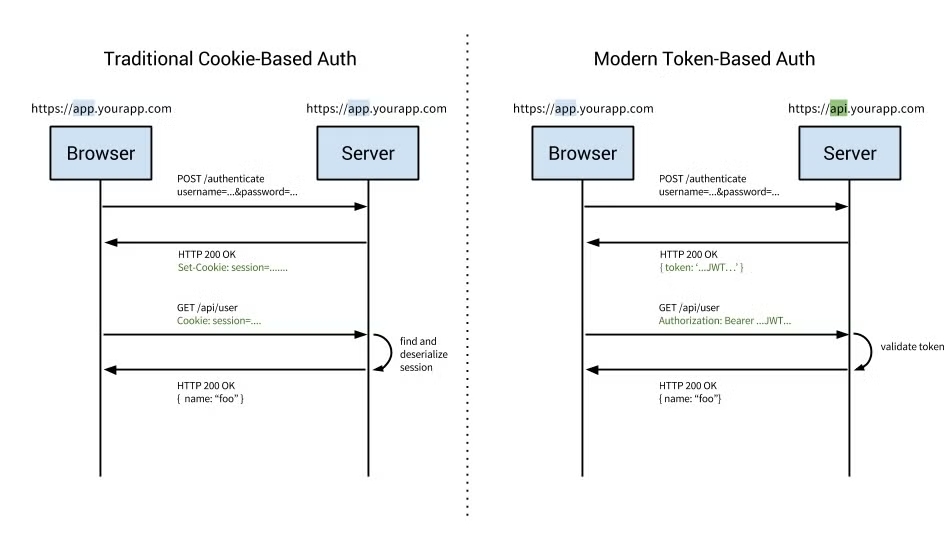
It specifies features and attributes of objects and shows how they're linked together. UML diagramming supports a variety of different types of charts that show the structure and behavior of your systems. See, for example, sequence diagrams, which are a more text-heavy way of representing the planned behavior of your API. Take this example from Auth0, which shows the difference between cookie and token-based authorizations:
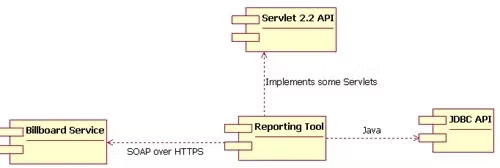
This kind of granular detail can help you lay out proper workings for your software through a few easy-to-follow examples. You can also structure elements, as seen in this chart from an IBM report on UML:
And this stylized example from Auth0, which depicts the flow of single sign-on:
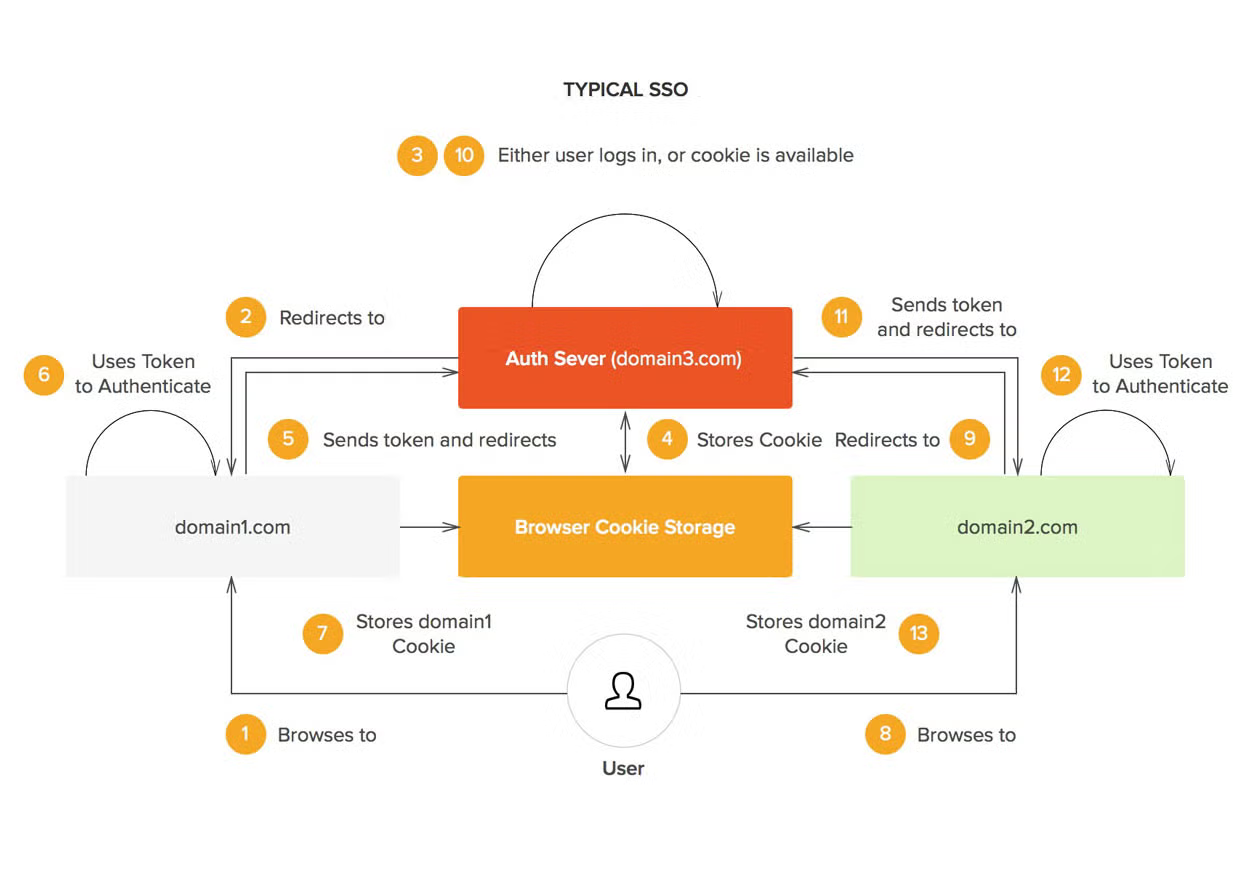
These might fall under the structural type of UML diagram, with the IBM example being a more stylized version. Through UML diagrams, you can clearly illustrate how your core function works, how you are interacting with APIs, or how other companies will call on your API and what that will look like to their developers.
Creating a UML API diagram is a great way to communicate how your API works to other developers. Especially if you follow the Auth0 examples and take your diagram up a notch by adding more color, making it clearer and more reader-friendly. A well-thought-out diagram is a true resource that you can use to pass on knowledge to the people working with your API.
Want to see a real-world example? Check out this blog on visualizing APIs with sequence diagrams >>
Back to topCodify Your Process with API Diagrams
Keeping everyone on track and aligned means that you need to have documentation like the diagram you just created to move forward. As you continue to build and develop, having a streamlined process for making and storing charts, diagrams or plans for your projects is key. Developing guidelines about what types of diagrams you use (like UML diagrams) can keep information easily accessible down the line.
To learn more about UML diagraming with Gliffy, check out these resources: