Data flow diagrams (DFDs) or data flow charts map out the flow of information throughout a system or process using defined symbols, text labels, and varying levels of detail to display information.
DFDs help non-technical audiences understand how data flows throughout a software system — and when paired with strong data storytelling, they can make complex information more accessible and actionable.
To learn more about DFDs, read on or jump ahead to one of the following sections:
Back to topData Flow Mapping with DFDs
Developed decades ago as a way to keep up with changing technology, the DFD methodology helped capture the increasingly complex flow of data in a computer system. Data flow diagrams weaved together multiple popular concepts in information system design to become popular in the fields of academia and business analysis.
Today, a data flow diagram is used in several ways:
- Software Engineering: data flow diagramming provides structure before coding begins and is one of the most helpful application architecture diagrams
- Agile Development: allows developers to better visualize requirements as they build on existing work
- Business Analysis: these diagrams provide a framework to examine existing systems and remove inefficiencies
For more on use cases for DFDs and other flowchart types, visit our resource, What Is a Flowchart Used For?
Back to topExample of Data Flow Diagram
In this example, we see several steps in the process of enrolling students at a university and all the inputs and outputs of data required for each step.
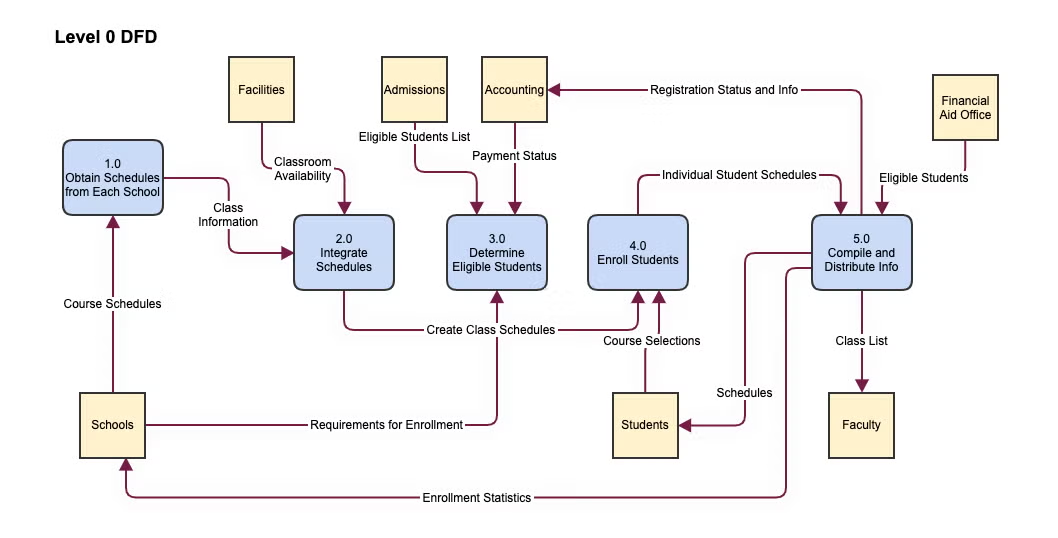
It’s important to remember that these flows of information don’t necessarily have to happen in chronological order, even though the processes in the rounded-corner rectangles do.
Back to topWhat’s the Difference Between Data Flow Diagrams and UML?
While data flow diagrams show the flow of information through a system, they may not be as specific or detailed as a diagram made with Unified Modeling Language. Typically, DFDs don’t capture interactive or real-time systems as well as some types of UML diagrams, but they are easier to learn and make. These blog posts will help you learn more about UML:
Back to topTypes of Data Flow Diagrams: Logical vs Physical Data Models
There are two distinct types of data flow diagrams: the logical DFD and the physical DFD. Logical DFDs take the perspective of the business or its activities, looking at what information is moving through the system. Meanwhile, physical DFDs focus on how information moves throughout the system or how the information flow is implemented.
Example of Logical vs. Physical DFDs
A great example of this would be that a logical DFD of a grocery store checkout process would include things like an item number, prices, and receipts. A physical DFD would instead take note of details like bar codes, transaction files, and payment details like a credit card number. It’s almost as though the logical DFD is how a customer or cashier would describe the process, while the physical DFD is how a computer would describe the process.
Using Logical vs. Physical DFDs
Because of the nature of logical vs. physical DFDs, it can be easier to start by describing the logical process. A logical DFD will help you describe the process as its users experience it, which can help you identify inefficiencies or challenging steps to eliminate.
With your understanding of the logical flow, you can then more easily think through how that information physically moves along the same process. The physical DFD will include more technical details to help you build or optimize your system.
Back to topWhat Are the 3 Levels of Data Flow Diagrams?
Because DFDs can show such varying depths of information, it’s valuable to think of them — and sometimes even build them — using layers. Most commonly, you can think of these layers of information as level 0, 1, and 2 DFDs.
Level 0 DFDs: What are Context Diagrams?
At level 0, DFDs are also called context diagrams, which show the interactions between the system and its environment, including external factors.
This is the most basic view of your system and can be easily understood by anyone at a glance. It’s helpful for describing the system during presentations to executives or while collaborating with non-technical analysts.
Level 1 DFDs
Moving up to level 1, your data flow diagram will layer in more detailed information about the process. Rather than thinking of the broader overview, you’ll instead break the diagram into smaller pieces that start to describe the steps of the process.
For example, thinking through registering for classes at a university, instead of just documenting how information flows in and out of the registration process, you might consider the steps in the process and what information is specific to each of those steps. This would include details on information used by teachers to create their course offering, information used by facilities to create course schedules, and information used by students to register for those classes.
Level 2 DFDs and Adding Higher Levels
Higher level DFDs allow you to dive deeper into each step and flow of information. In the example of students registering for classes, you might consider multiple sub-processes, like them requesting access to a fully-enrolled course, joining a waitlist, or moving between sections of the same course.
Using Layers for DFD Levels
When you use a diagramming tool like Gliffy, you can add layers to your diagrams so that each level of your data flow diagram can be represented together. These make it easy to reference the context diagram while also trying to understand deeper levels of information.
Back to topMake a Data Flow Diagram Online with Gliffy
Using Gliffy’s online flowchart maker, you can create a data flow diagram directly in Confluence in just a few clicks. Get started with a free trial, and you'll be diagramming your way to better documentation in no time.