What is an ER Diagram?
Entity Relationship Diagrams, also called ERDs or ER Models, are a diagram that describes how entities relate to one another within a defined space or system.
When you know how to use an entity relationship diagram, you can make sure that large sets of data are organized, which means ERDs are most often used for software, analytics, and research projects. Read on for more entity relationship diagram examples and learn how to use these popular database diagrams.
Get started with a free trial of Gliffy's ERD tool today. >>
Back to topVideo Guide: How to Read ER Diagrams
How to Read Entity Relationship Diagrams
Think of ERDs as using their own, simple language. Here are the key “translations” you need to know:
What is an Entity?
The entity of an ERD is simply a specific noun that carries data to describe it. In an ERD, you’ll use rectangles to designate entities.
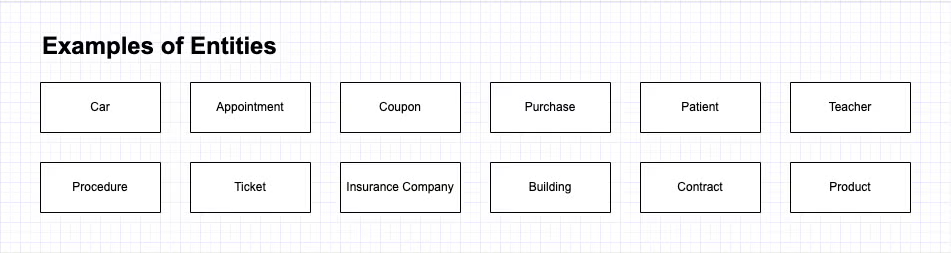
Entities can also be described in types, sets, or categories. For example, a single customer would be an entity, while the broader noun “customers” would be an entity type. Entity sets are like an entity type, but also include an element of time, so an example would be “customers who came in last week.”
What is a Relationship in ER Models?
In an ERD or ER model, relationships are the verbs that describe how your entities interact with one another. Relationships are shown with a diamond.
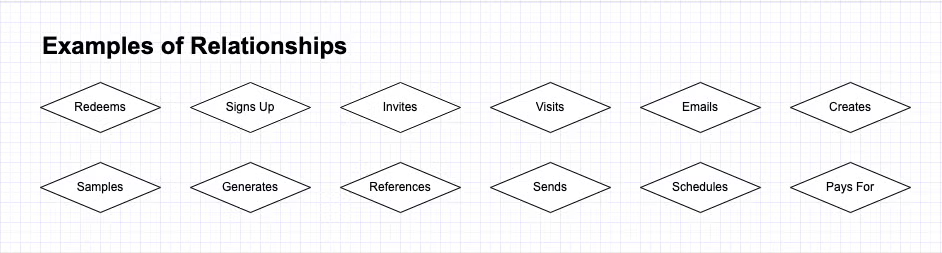
An example of a relationship within an ER model would be the interaction of two entities. Using our “customer” example from above, another entity could be “coupons.” The relationship between these two would be the verb, that the customer redeems a coupon.
What is an Attribute for an ERD?
Attributes are the adjectives or pieces of data that you capture about an entity. When you make an entity relationship diagram of your own, you’ll use an oval to designate these attributes.
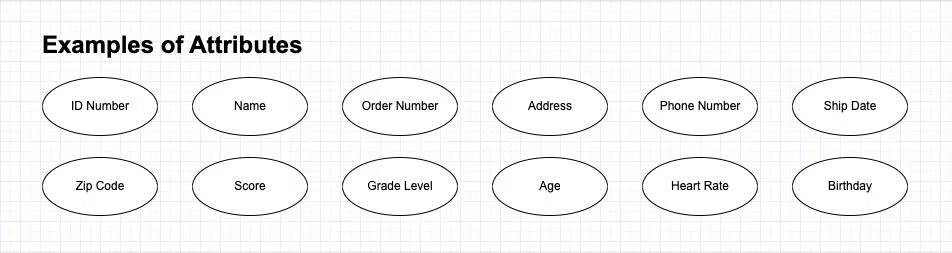
So if we’ve identified customers and coupons as entities for our diagram, attributes would be the data we collect around either the customers or the coupons. These attributes can be customer names, coupon codes, payment methods, the amount of money saved with the coupon, or even whether that customer chose paper or plastic at the checkout lane. Whatever data you’re collecting can show up in your diagram as an attribute.
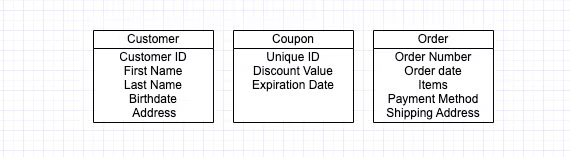
Combining Entities and Attributes
The above notations work great for a conceptual model of your architecture, but you can be more specific by using a different set of notations. Without complicating things too much, simply think of this step as collapsing your attributes under each entity.
Using Lines in ERDs
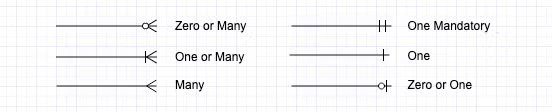
Lines in entity relationship diagrams are important because they further explain the relationships and attributes of the data you’re describing. These line types are called the cardinality in your diagram. These lines tell you whether the connection between an entity and attribute can have zero, one, or many points of data. The cardinal relationships are:
- Zero or one
- One
- One and only one
- Zero or many
- Many
- One or many
For example, one and only one adult should have zero or one driver’s license numbers. An adult may not have their license yet, so there may not be any data here (zero), but they also should never have more than one driver’s license number. Likewise, the same license number should never be given to more than one adult. When it comes to phone numbers, many adults might have multiple numbers on record while some might not have any phone numbers recorded, so you’d use zero or many in that case.
When you’re reading an ERD, simply keep the key in mind. When you learn how to make an ERD, selecting which line to use can take some getting used to — but don’t overthink it!
Back to top
How to Use ERDs to Build a Database
Whether you’re trying to organize data or planning to collect it, it’s never too early to start creating a plan with an entity relationship diagram. Here are a few key rules so that you can make the most of an ERD.
1. Define your Entities
Get started by identifying the entities involved in the system you’re describing. Give each entity its own rectangle.
2. Think of Each Entity as a Spreadsheet
For every entity you draw, be prepared to have a spreadsheet for it. There may only be two or three columns, but this is an important way to make sure you are capturing all the info you need — and putting it in the right places.
3. Add the Attributes for Each Entity
If each entity you’ve identified gets a spreadsheet, these attributes will be the columns in that spreadsheet. Keep in mind that it’s okay for these attributes to be null in your spreadsheet, but create a space for them if you are able to collect the data. A great example of this would be a customer’s birth date — not every customer would share it, but if you collect the data, you want to keep it associated with the correct customer.
4. Draw in the Relationships
As you draw in the relationships, look for places where you want the same data to live in multiple spreadsheets. For example, if you assign a unique ID number to every customer, you would want that number to be an attribute in both the customer entity and the entity capturing orders at your store. By thinking of relationships in this way, you can identify which sets of data should define an attribute and which sets of data should reference it.
5. Reference and Refine Your ERD
The great thing about making an entity relationship model in Gliffy is that you can easily edit your diagram as you make changes to your database structure. By keeping a record of how you’ve structured your data throughout a project, you can better collaborate with teammates and communicate what you’ve learned with stakeholders.
🔹 Want more help? Check out our blog, How to Draw an Entity Relationship Diagram >>
Back to topUse Gliffy's ERD Tool for Entity Relationship Diagramming
Ready to tackle that project? Get started with a free trial of Gliffy for Confluence.
For more help, here are more resources with entity relationship models and ER diagram examples:
- How to Make an Entity Relationship Diagram
- Entity Relationship Diagram Symbols
- Entity Relationship Diagram Templates