Concept maps are a helpful tool to quickly visualize the relationships between objects or ideas.
Concept mapping is a popular exercise for students, but making a concept map can help business professionals document information as well.
To learn more about concept mapping, read on or jump ahead to one of the following sections:
Want to get started right away? Make a concept map with a free trial of Gliffy >>
Back to topWhat is Concept Mapping?
Concept maps are a method of structuring your thoughts or quickly visualizing information.
But, more specifically, there are a few use cases that work perfectly for concept mapping.
Brainstorming
Concept maps can help you quickly structure or organize the information generated from a brainstorming session. Rather than ending up with a stack of sticky notes or pages and pages of scribbled ideas, using a map to capture ideas while brainstorming can help you categorize and group your ideas.
Researching
When you start your research with a broad subject, it can be hard to know where to start. Doing a quick mapping exercise can help you identify specific categories or subtopics to research. Mid-project, creating a concept map and cross-referencing the information you’ve collected can also help you identify missing pieces of information.
Onboarding
HR teams and managers can use concept maps to quickly and effectively introduce company policies, organizational structures, or new technical information to employees. Because visuals have been shown to make information more memorable, this means sketching out an image for an employee or adding a concept map to your onboarding materials will be an effective way to introduce new ideas.
Back to topPopular Types of Concept Maps
There are four common types of concept maps. All four use the idea of drawing concepts and connecting them to demonstrate relationships, but the type of relationship can change which type of map you’ll use.
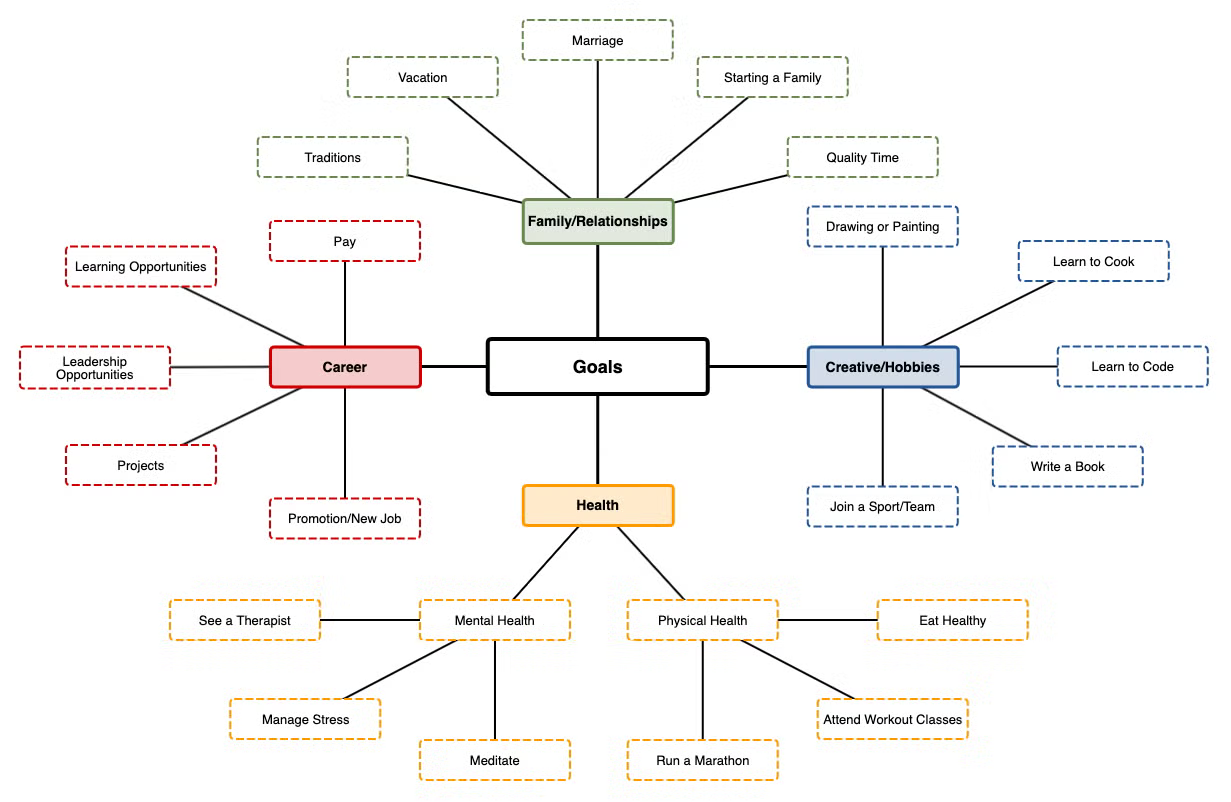
1. Spider Maps
Similar to mind maps or cluster diagrams, spider maps start with a single topic at the center and then split into subtopics organized around the center. Mind maps or spider maps are great for brainstorming.
2. Flowcharts
Flowcharts are an extremely popular diagram that show the steps of a process or the chronological progression of your topic.
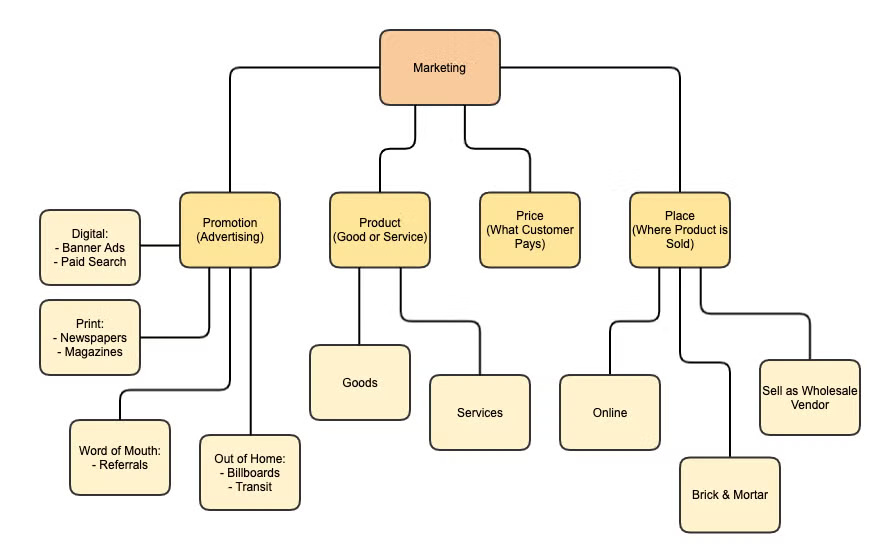
3. Hierarchical Maps or Chronological Maps
These maps show a clear pattern over time or a structured breakdown from the most general part of the topic to the most specific. They’re kind of like org charts, but for information or ideas.
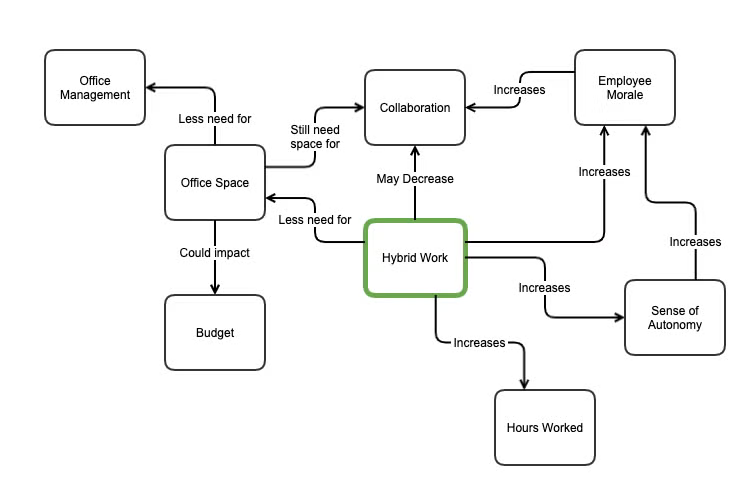
4. System Maps
System maps are the most complete concept map, meaning they carry the most information about the ideas and relationships in your topic. Relationships can carry annotations like a plus or minus sign to indicate a positive or negative relationship or correlation.
Back to topConcept Map Examples
Spider Map Example & Spider Map Template
Hierarchical Concept Map Example & Hierarchical Concept Map Template
Systems Map Example
 Back to top
How to Draw a Concept Map
Drawing a concept map directly on any Confluence page with Gliffy is as easy as drag and drop. Make sure you’re signed up for your free trial, then you can follow these steps to capture your ideas.
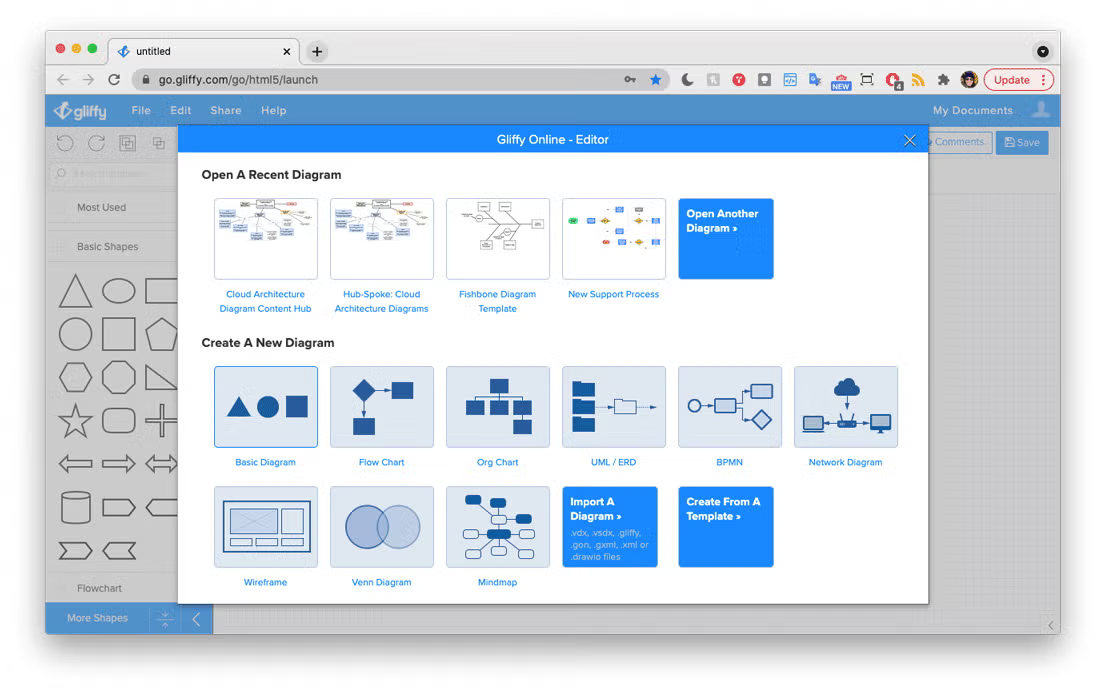
Step 1: Start with a Basic Diagram in Gliffy
This pre-loads a basic set of shapes that you can use to brainstorm ideas.
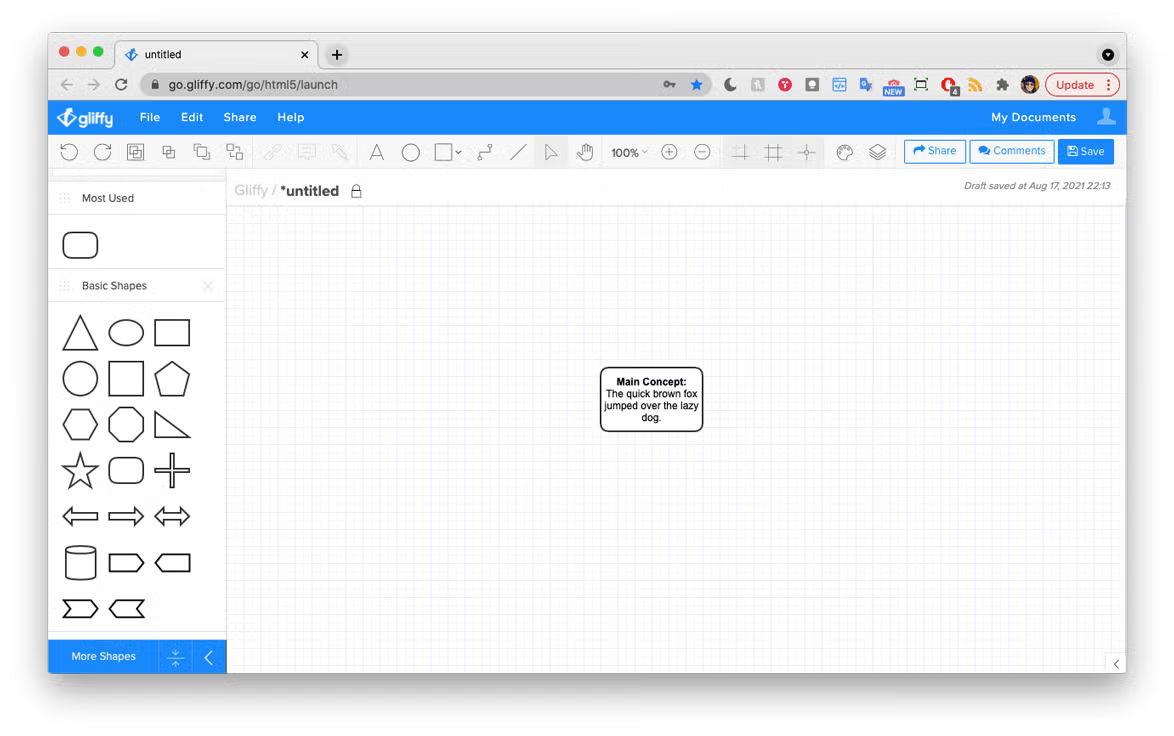
Step 2: Drag and Drop a Shape for Your Main Concept
Click on any shape from the basic shapes panel, then drag and drop it onto the right side of your diagram. Then, just type to add your problem statement to that shape.
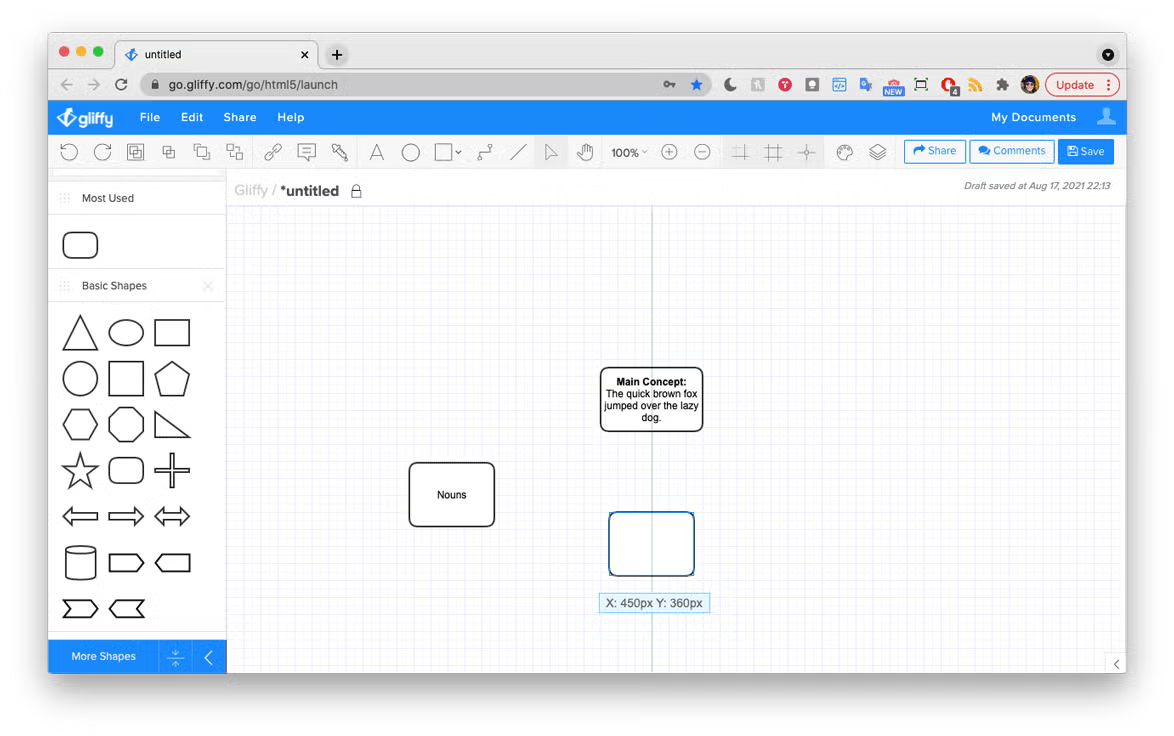
Step 3: Drag and Drop More Shapes for Subtopics or Ideas
As you come up with ideas or subtopics, you can drag and drop out additional shapes from the shape panel on the left. Just click on a shape and type to give it its own description.
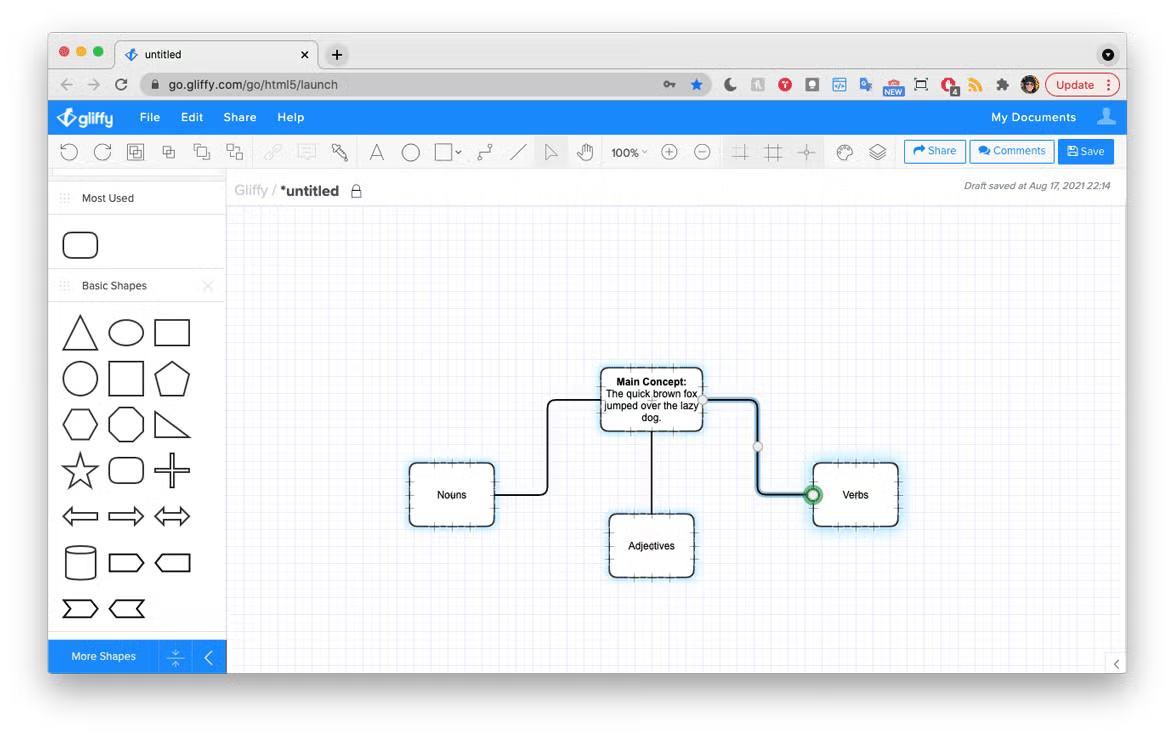
Step 4: Use the Connector Tool to Draw Relationships
Find the connector tool in the toolbar across the top of the diagram maker. Select this tool, then hover over the edge of one of your shapes until you see a green circle appear around your cursor. Then, click and drag from that spot to another locking point on a shape — you’ll see a green circle appear around your cursor again.
Just like shapes, you can click on a line and type to add a description for the relationship between two ideas.
Tip: to add extra detail or longer descriptions to the topics or relationships in your diagram, check out the pop-up notes tool.
Step 5: Save and Share Your Diagram
Use the share button in the upper right to create an always-updated link to your diagram. Then, when you make tweaks or changes to the diagram, the link will always show the most recent version.
Back to topConcept Mapping in Gliffy
With Gliffy, diagramming is simple and fast — you can just drag and drop shapes at the speed of your ideas. Start your free trial and try using Gliffy to make a concept map today.