What Is a Flowchart?
A flowchart visually shows the steps or progression of a process in sequential order. It uses lines to indicate directional flow and a standard set of symbols to describe the step-by-step procedures, inputs, and decisions in the process.
A well-made flowchart can be used to break big ideas into small, bite-sized pieces that are expressed visually, so knowing how to make one is sort of like having a universal language.
Flowcharting makes it possible to communicate with any stakeholder or audience, because visuals are typically easier to understand than words.
While the variations and versions of flowcharts are endless, here are a few common flowchart types explained and illustrated with flowcharting examples.
Process Flowchart or Process Map
Illustrate How a Process Works or Manage a Project
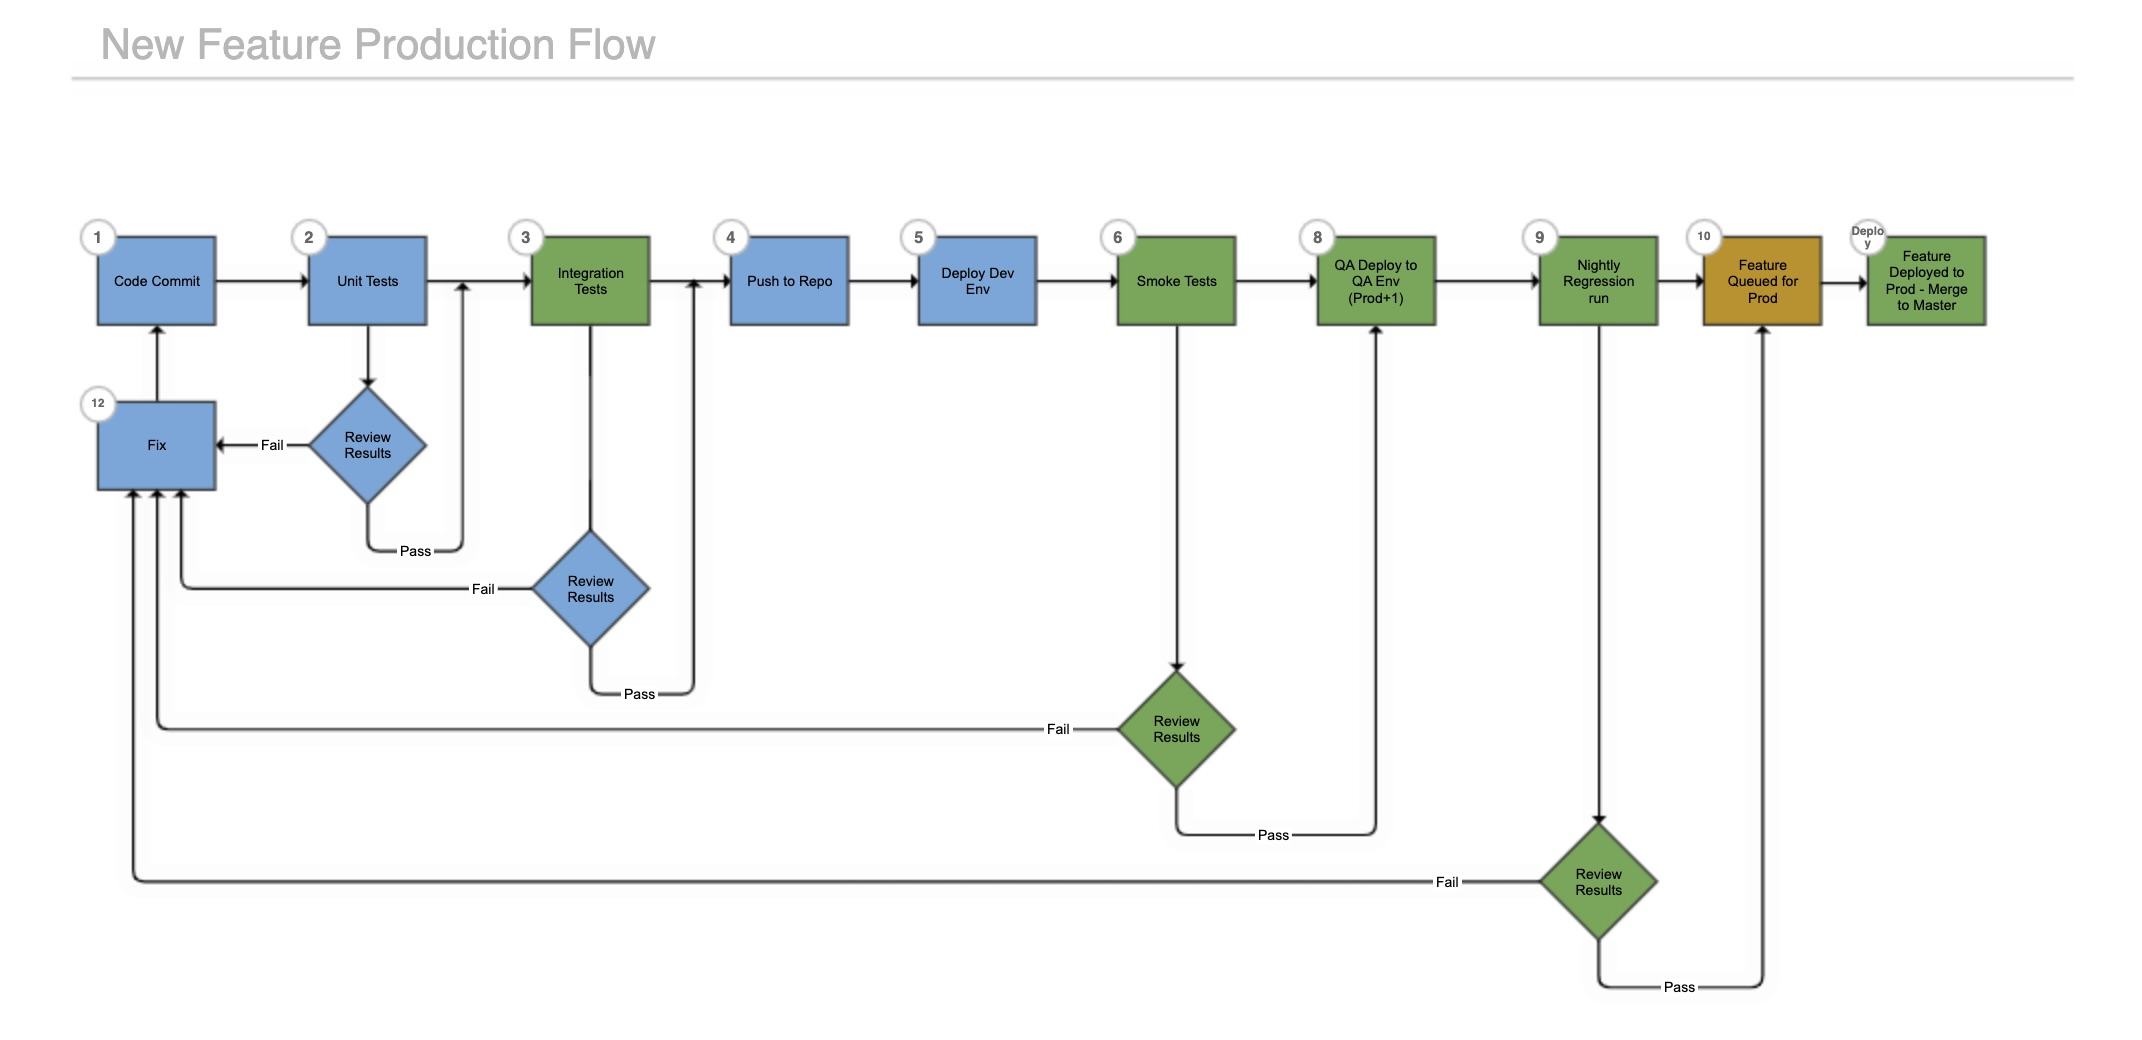
A process flowchart or process flow diagram is probably the most versatile flowchart type because it can be applied to virtually anything, from ITSM processes to approval processes. In fact, many of the other flowchart types we explore in this blog could be considered subcategories of process flowcharts.
Process flowcharts or process mapping can help quickly explain how something gets done in your organization. Sometimes, these types use a standard language or notation, like Business Process Modeling and Notation. Use a process flow diagram to:
- Map out roles and responsibilities within an organization to gain clarity
- Describe the manufacturing process or inputs that go into creating a finished product
- Explain how information is communicated throughout an organization or process
- Draw up a proposal for a new process or project to understand its scope and steps
Workflow Chart or Workflow Diagram
Understand How Data and Documents Flow Within Your Organization
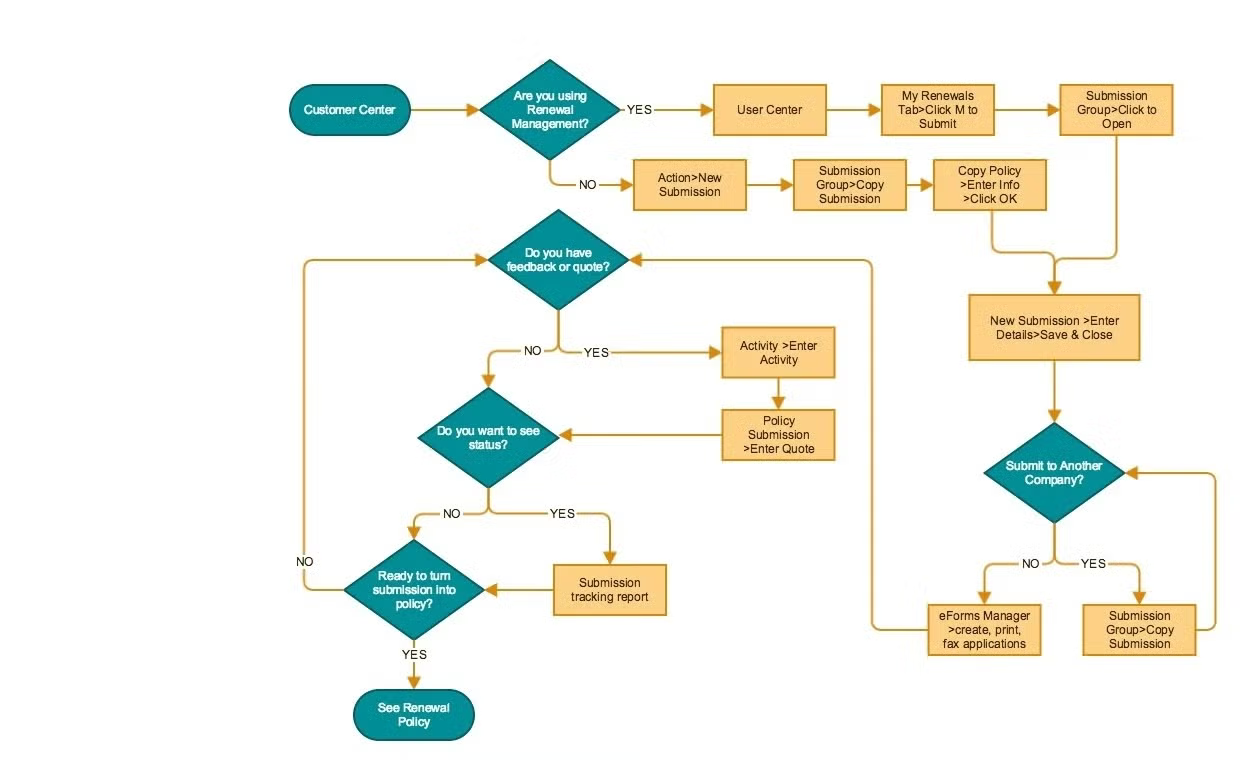
A workflow flowchart shows the way a business or process functions. The processes it depicts are tasks or series of tasks carried out by people, such as gitflow diagrams or standard operating procedures.
The example below illustrates the steps required for a potential customer to renew a policy through a company website. This type of workflow diagram can be used to:
- Train new employees
- Discover potential problem areas
- Clarify business operations by showing a high-level overview
Decision Tree Diagram
Guide Users Through Each Step of a Process
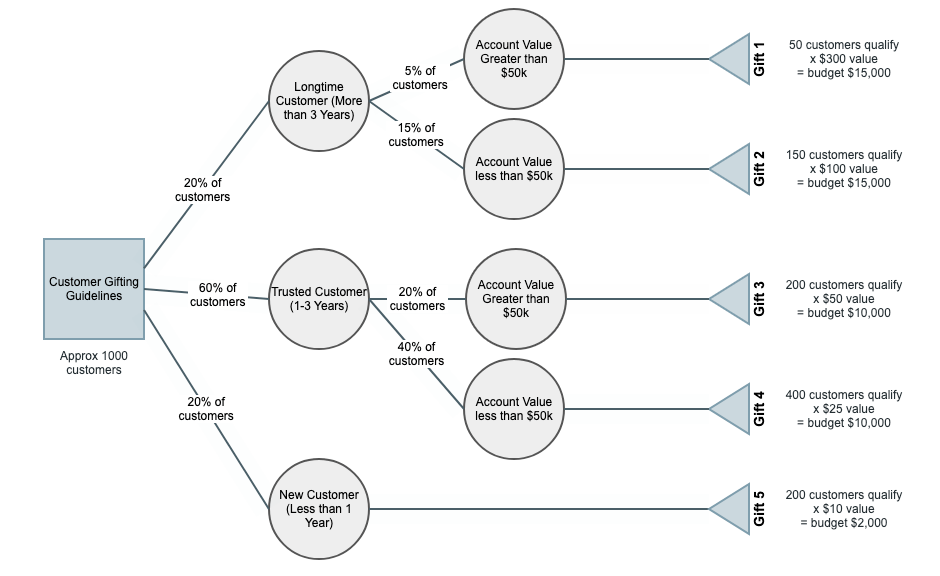
A decision tree is a type of flowchart that helps teams visualize choices, possible outcomes, and the paths leading to those outcomes. Unlike general flowcharts, decision trees focus on a single decision or classification, guiding users through a series of conditions to reach a conclusion.
Decision trees are particularly beneficial for processes that are repeated or shared among team members. By mapping out potential outcomes and providing clear guidance, they ensure tasks are completed consistently, regardless of who is responsible.
For example, in IT service management, decision trees can help new team members resolve issues efficiently by following a predefined process. Similarly, in business, they can standardize decisions like customer gift selection based on specific criteria, ensuring accuracy and fairness.
Back to topSwimlane Diagram
Describe How Separate Departments, Processes or Employees Interact
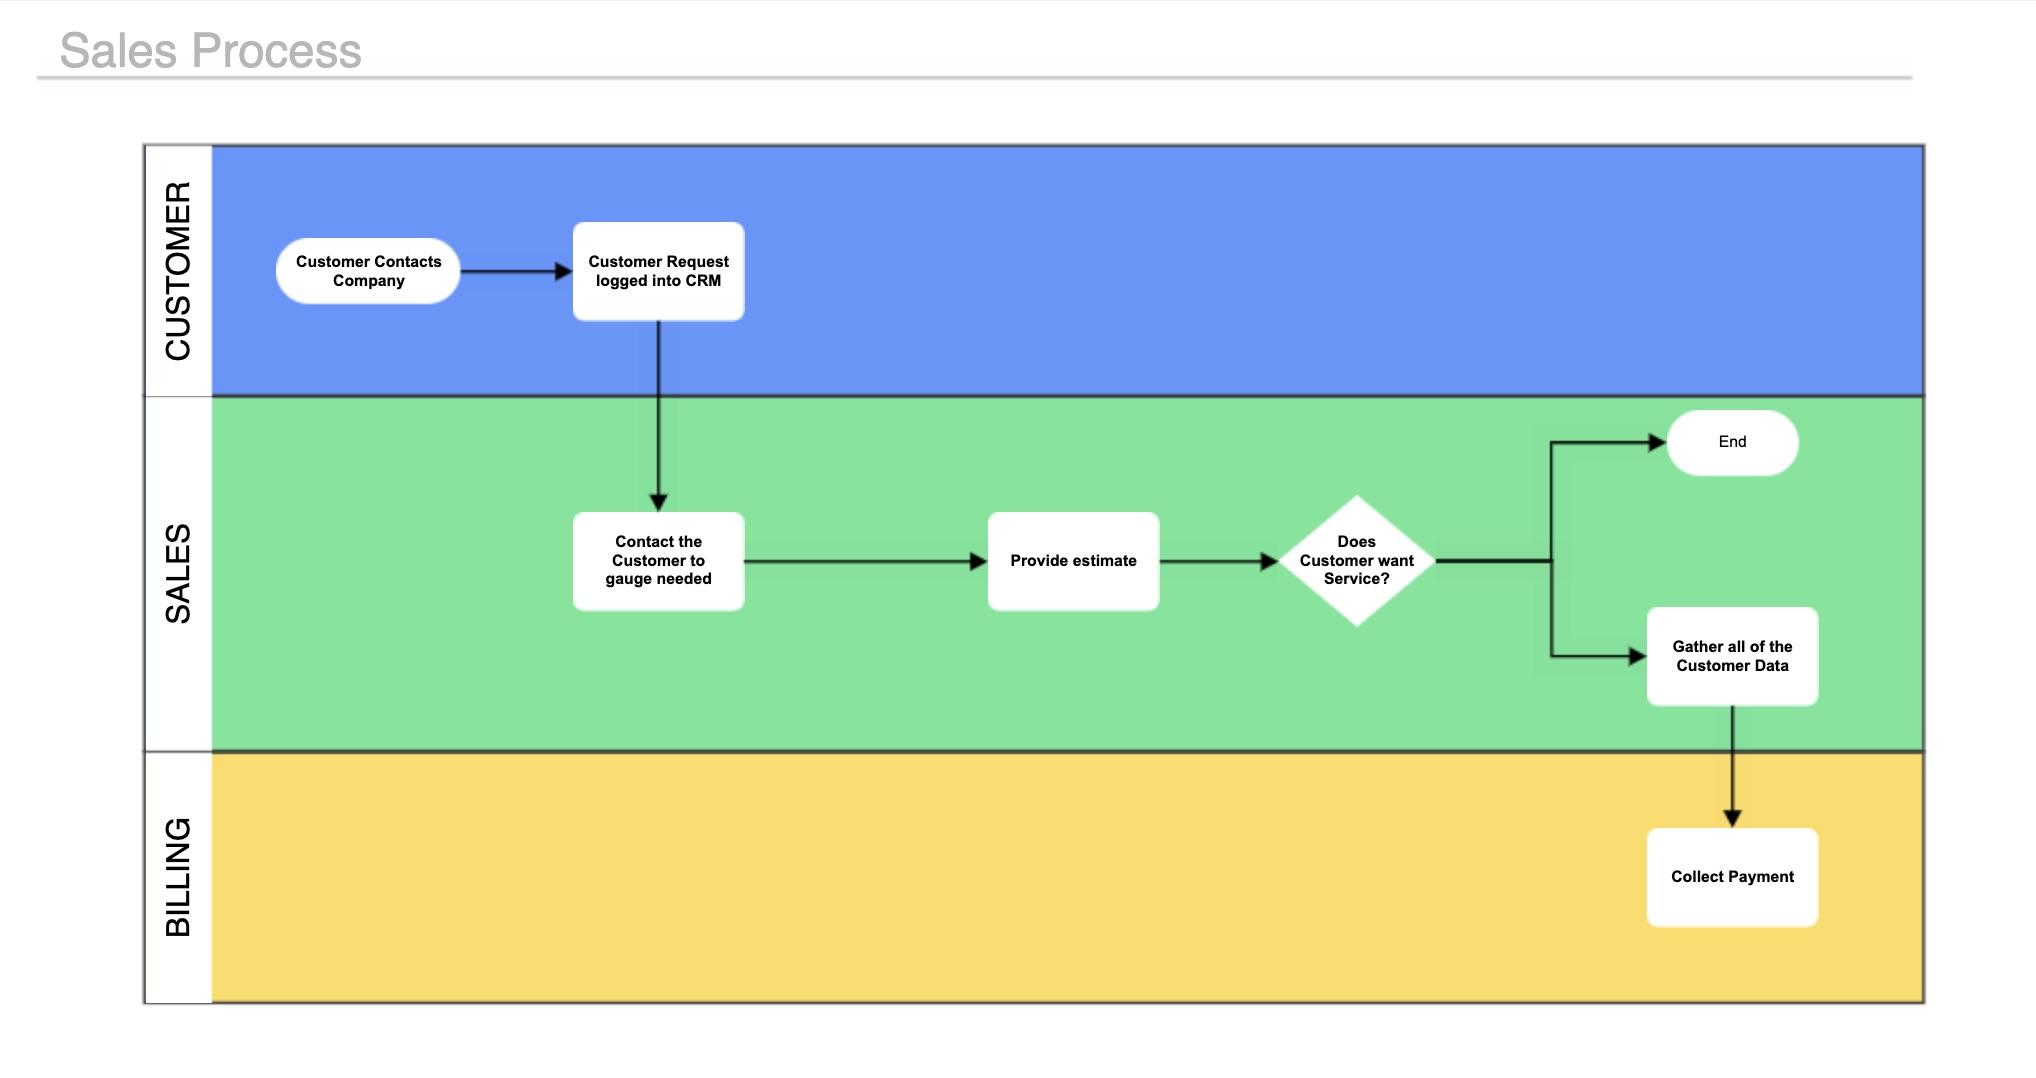
The swimlane flowchart comes in handy when you need to show multiple flows of information side by side. Swimlane diagrams might sound similar to workflow diagrams, but the key difference is that they allow you to create different categories where activity takes place.
A swimlane flowchart or diagram is great for documenting a whole process that interacts with different segments of an organization or requires collaboration among different teams. The swimlane diagram example below illustrates the way an internal-facing department runs parallel with an external-facing one and the points in the process where they interact with one another.
More complicated diagrams could include five, six, or even more swimlanes, like one for each department within an organization or each role on a cross-functional team. Separating the different flows into swimlanes brings clarity to the process and allows for diagram viewers to get the information they need faster.
Learn more about swimlane diagrams with our resource videos, What is a Swimlane Diagram? and How to Make a Swimlane Diagram.
Back to topContext Diagram or Data Flowchart
See Where Data Flows In and Out of an Information System
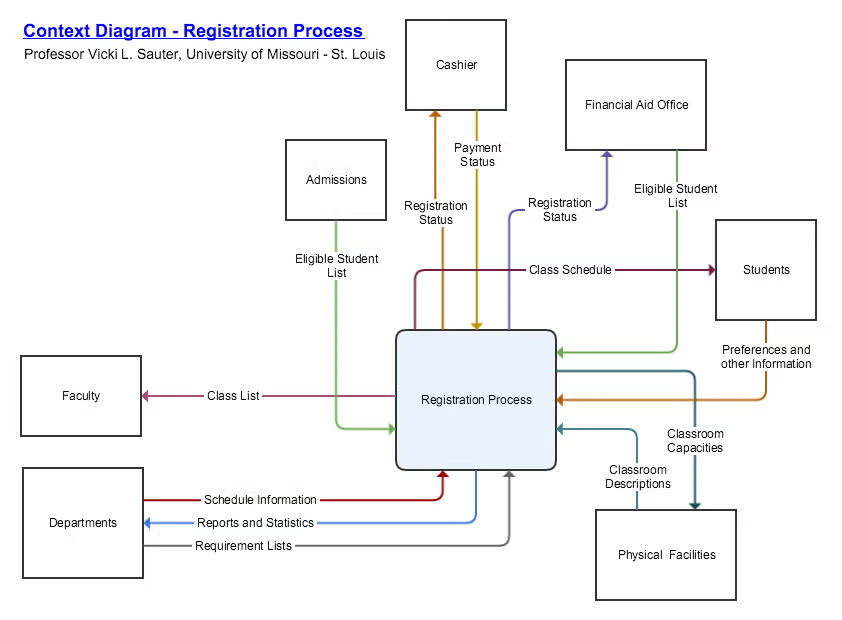
Context diagrams and other data flow diagrams show how data moves through an information system using the flowchart format. Although most often used for software development and design, they can be used to analyze any type of information flow, like how information moves through a business.
In the context diagram below, we see how information shared during a university student registration process is then shared with departments across the university. That process creates a schedule output for the students, provides faculty members with class lists, and assigns classrooms to each course.
Meanwhile, that process receives information about which students are eligible to take courses using inputs from the department’s requirements lists, the financial aid offices, and the admissions offices.
Unlike other flowcharts, context diagrams and data flow diagrams don’t indicate a sequence of events, but simply the exchange of information and the directions of that exchange. You can learn more about data flow diagrams in our blog, What is a Data Flow Diagram?
Back to topImpact Maps
Align Your Team’s Priorities with Business Goals
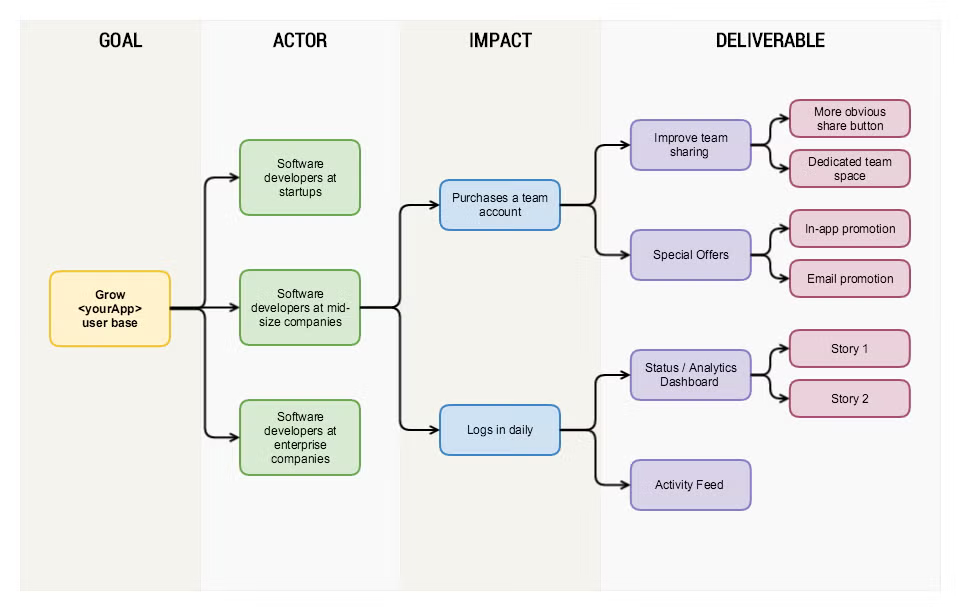
Impact maps are a specialized type of flowchart that illustrate the connections between specific deliverables and business goals. Each impact map starts with a goal, then flows across channels such as “actor,” “impact,” and “deliverable,” as shown in our impact map example below. These columns each contain information describing the tactics that will help you achieve your goal.
In the impact map template and example below, we see how a goal like “grow your userbase” is relevant to different actors, what actions those actors can take, and what deliverables can trigger those actions.
Read from left to right, this impact map example explains what tactics (like creating a clear button to improve user sharing) will help accomplish the overall goal and aligns the team on how their deliverables serve that goal.
Back to topHow Do Flowcharts Improve Workflows?
All the common flowchart types listed above—and other flowchart variations not mentioned here—do one thing well: they visually capture a step-by-step process.
In any field, flow diagrams or flowcharts document a process and give teams the ability to optimize that process through process analysis. They also make it easier for new employees or users to understand the process as they learn.
Here are a few ways flowcharts can help different departments across your organization improve their own workflows and support team collaboration.
Marketing Campaign Diagrams
In sales, flowcharts can be used to:
- Show the sales process and chart an opportunity's movement through that process
- Help identify opportunities based on data
- Guide sales representatives' decisions on pricing packages or quotes to customers
- Document policies or communications plans
Software Development Workflows
Flowcharts can describe highly technical information in a clearer way. While coding or working in software, knowledge workers can use a flowchart to:
- Show how users navigate a page or use an application
- Describe how code is structured or organized
- Explain the flow of data through a system or a program
- Visualize an algorithm
Engineering Process Models
Visualizing process flows is extremely valuable in manufacturing, where standardization and uniformity are important. In manufacturing, they're used to:
- Show the ingredients, chemicals, or other inputs that go into the creation of a product
- Clearly illustrate the manufacturing process to show dependencies and bottlenecks
- Create a consistent quality assurance or evaluation process
Flowcharts for Business Operations
Visualizing your operations will help your team perform consistently. A flow diagram can:
- Help onboard employees by describing tasks or routines
- Document order and fulfillment processes
- Describe a project and identify milestones for its completion
What Are the Best Tools for Creating Flowcharts?
While there are plenty of online tools you can use to construct your flowchart, a diagram is most valuable when it’s easy for people to find and update.
With that in mind, if your team uses Confluence and other Atlassian tools for work management, you’ll want to choose a flowcharting tool like Gliffy that allows you to diagram directly in Confluence without the need for external connectors or screenshot uploads from other tools to your page.
Gliffy’s AI-powered flowcharting functionality helps you go from idea to finished diagram in record time, helping you improve planning, decision-making, and team collaboration without spending your entire workday on documentation.