Complex networks drive the modern world, and understanding them starts with the right visualization. Whether you're managing on-premises systems, planning cloud migrations, or fine-tuning hybrid architectures, network diagrams are indispensable tools for IT professionals and business decision-makers alike.
Dive in as we break down practical examples of physical, logical, and cloud network diagrams.
Back to top
Physical Network Diagrams
A physical network diagram displays the tangible aspects of the network, detailing where hardware like routers, switches, servers, and cables are located. These are especially useful for IT teams managing server rooms, offices, or data centers.
Network Rack Diagram Example
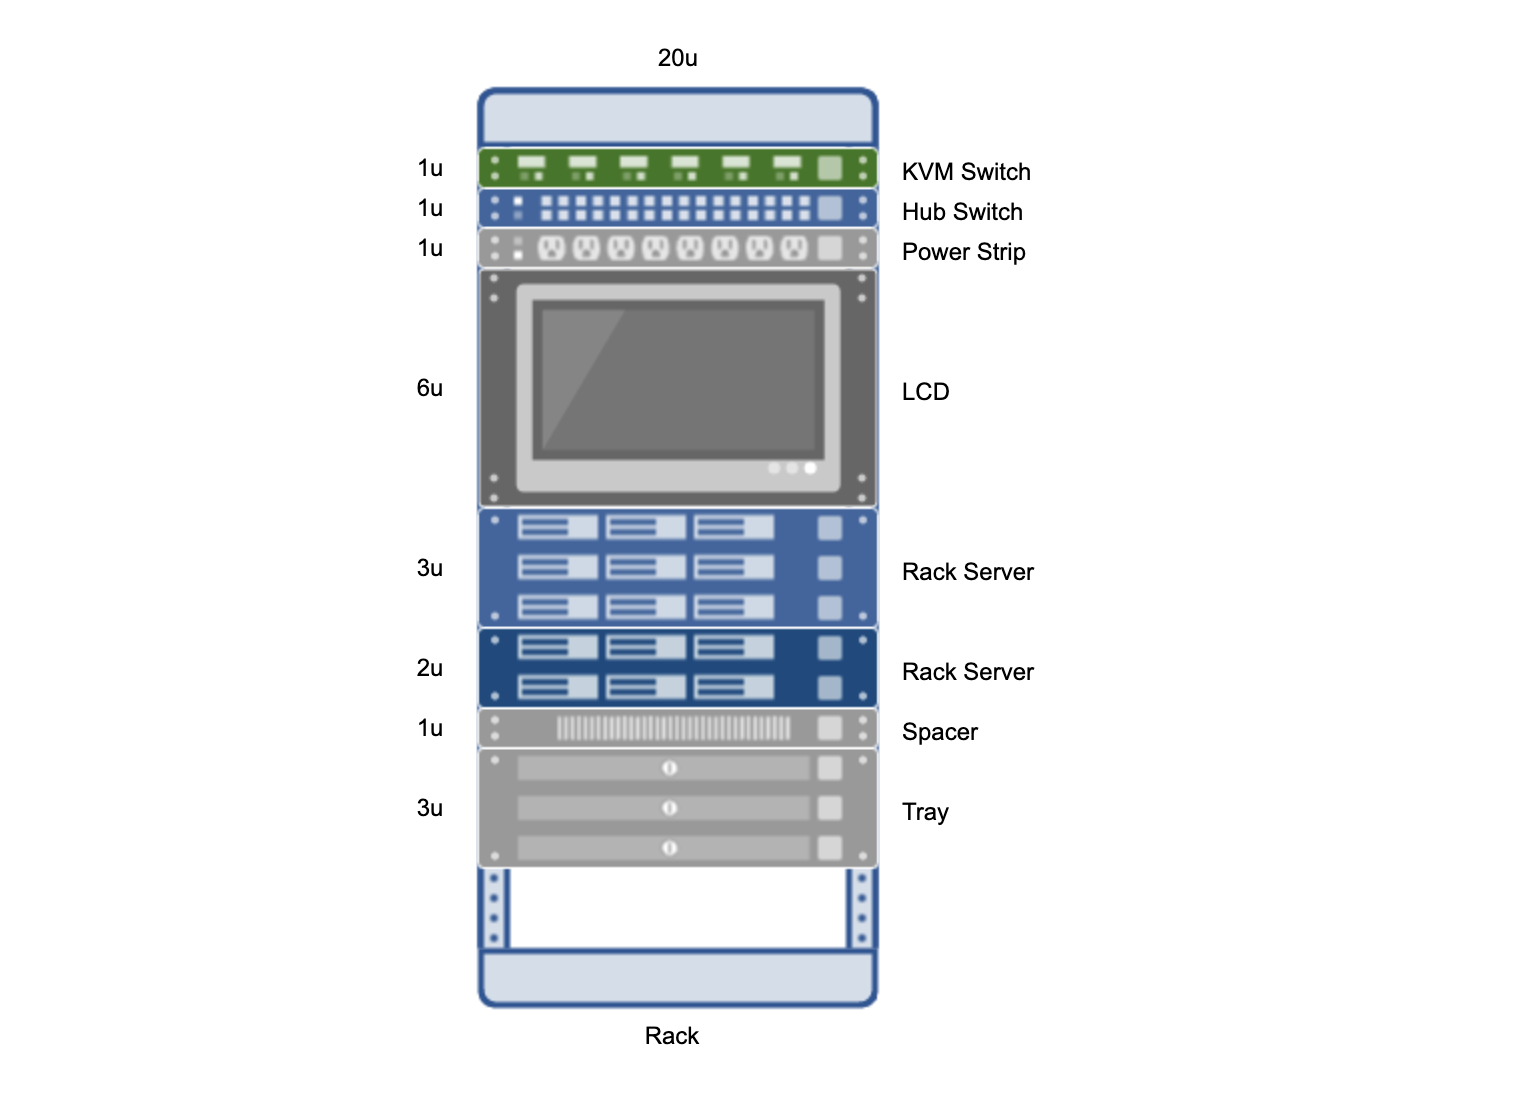
A network rack diagram is a visual representation of the equipment housed within a network rack, which is a physical framework used to organize and secure IT hardware. These diagrams illustrate the layout and arrangement of devices such as servers, switches, routers, patch panels, and other networking components within the rack.
They provide a clear, structured view of how equipment is installed and interconnected, often including details like device names, rack units (U), and cable management.
Office Network Diagram Example
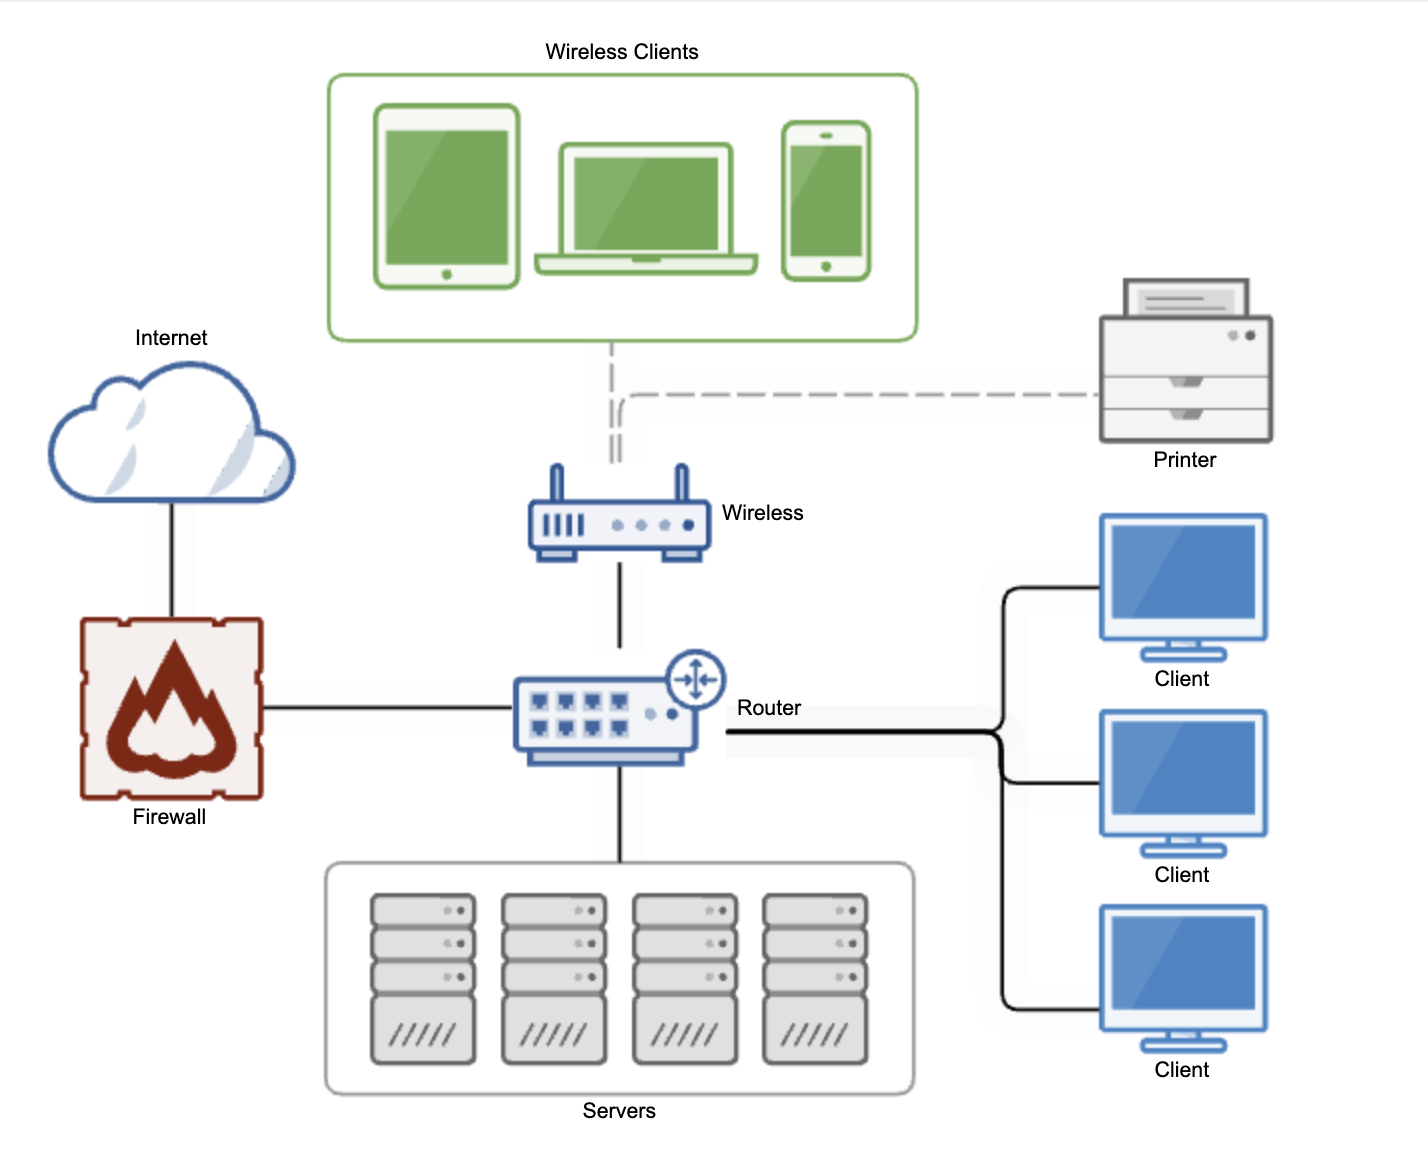
This diagram outlines the setup of a small business or office network. It includes key components such as routers, servers, printers, and workstations. With an office network diagram, you can ensure all devices are connected effectively and enable smooth communication within a localized area.
Back to topLogical Network Diagrams
A logical network diagram focuses on how data moves through a network, illustrating connections and pathways between devices. It prioritizes information like IP addressing, protocols, and groupings of components by function or role.
Enterprise Network Diagram Example
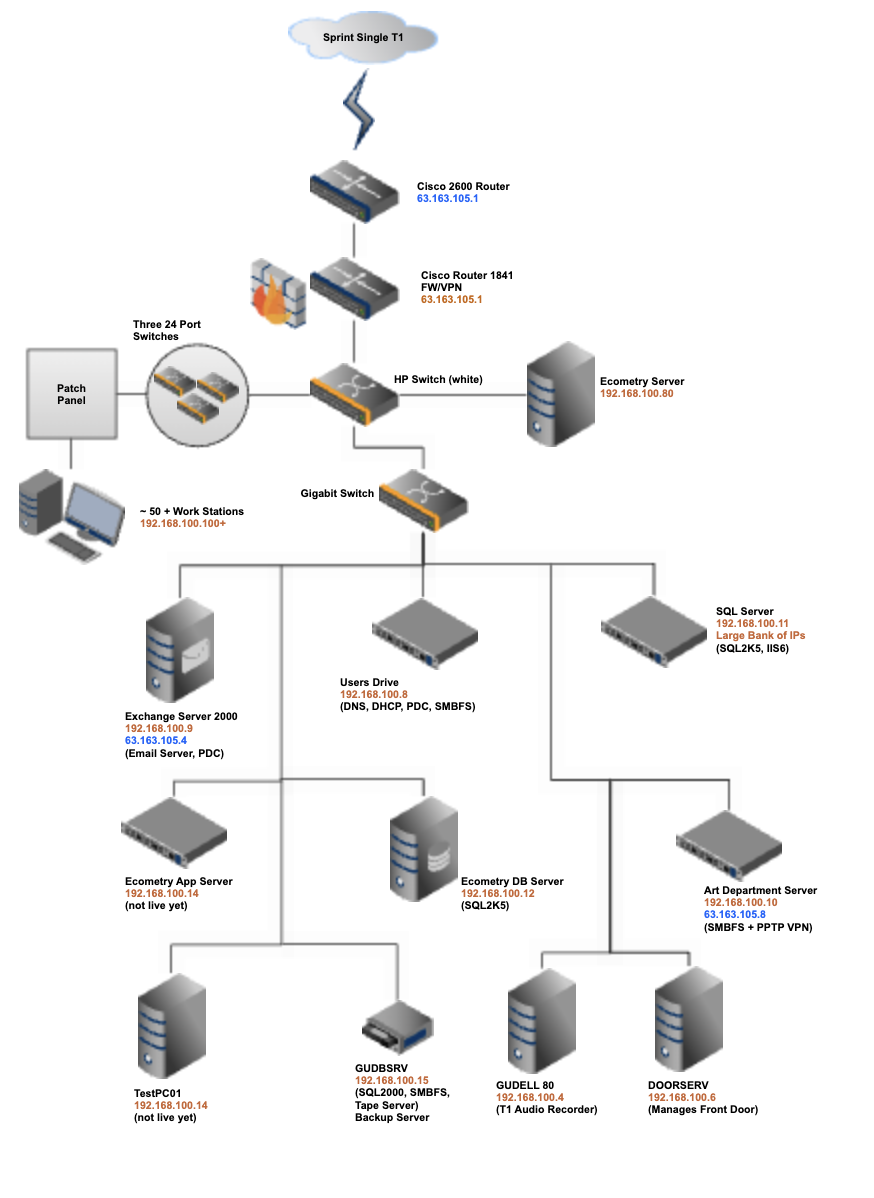
This enterprise network diagram example is a comprehensive illustration of a corporation's network, detailing servers, switches, and firewalls.
This type of diagram can help an in-house IT team manage large-scale IT operations, ensuring seamless communication across departments.
VLAN Network Diagram Example
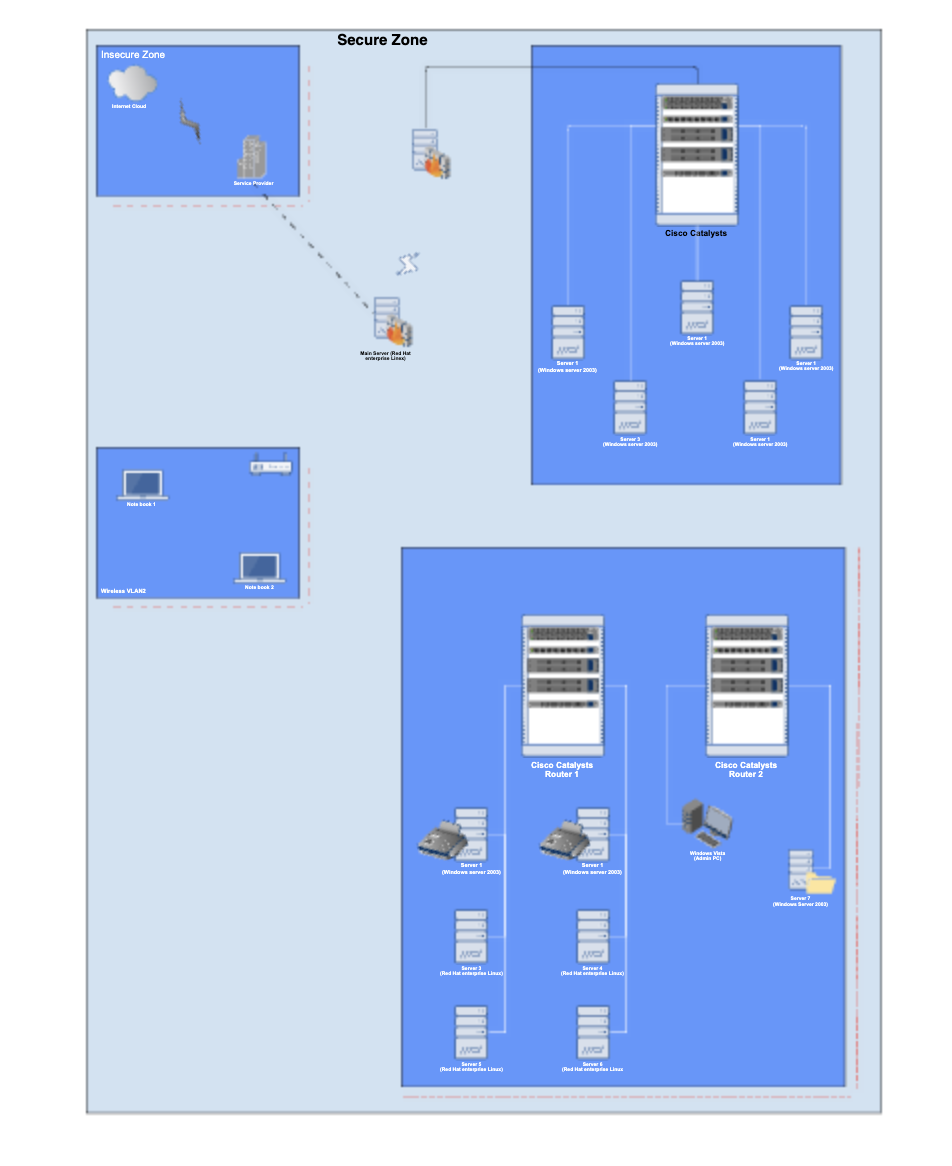
A VLAN (Virtual Local Area Network) is a logical grouping of devices within a physical network that allows them to communicate as if they were on the same physical LAN, even if they are not. VLANs are used to segment a network into smaller, isolated sections, improving performance, security, and manageability.
Common use cases include departmental segmentation, separating traffic for different departments, and guest networks that isolate guest devices from the main network.
VLANs are widely used in enterprise networks to optimize resources, enhance security, and improve overall network efficiency. The diagram above depicts the setup of a VLAN network.
Back to topCloud Network Diagrams
Cloud network diagrams represent virtual infrastructures, mapping interactions between cloud environments, on-premises systems, and hybrid networks. These diagrams are crucial for businesses heavily dependent on cloud computing.
AWS Diagram Example
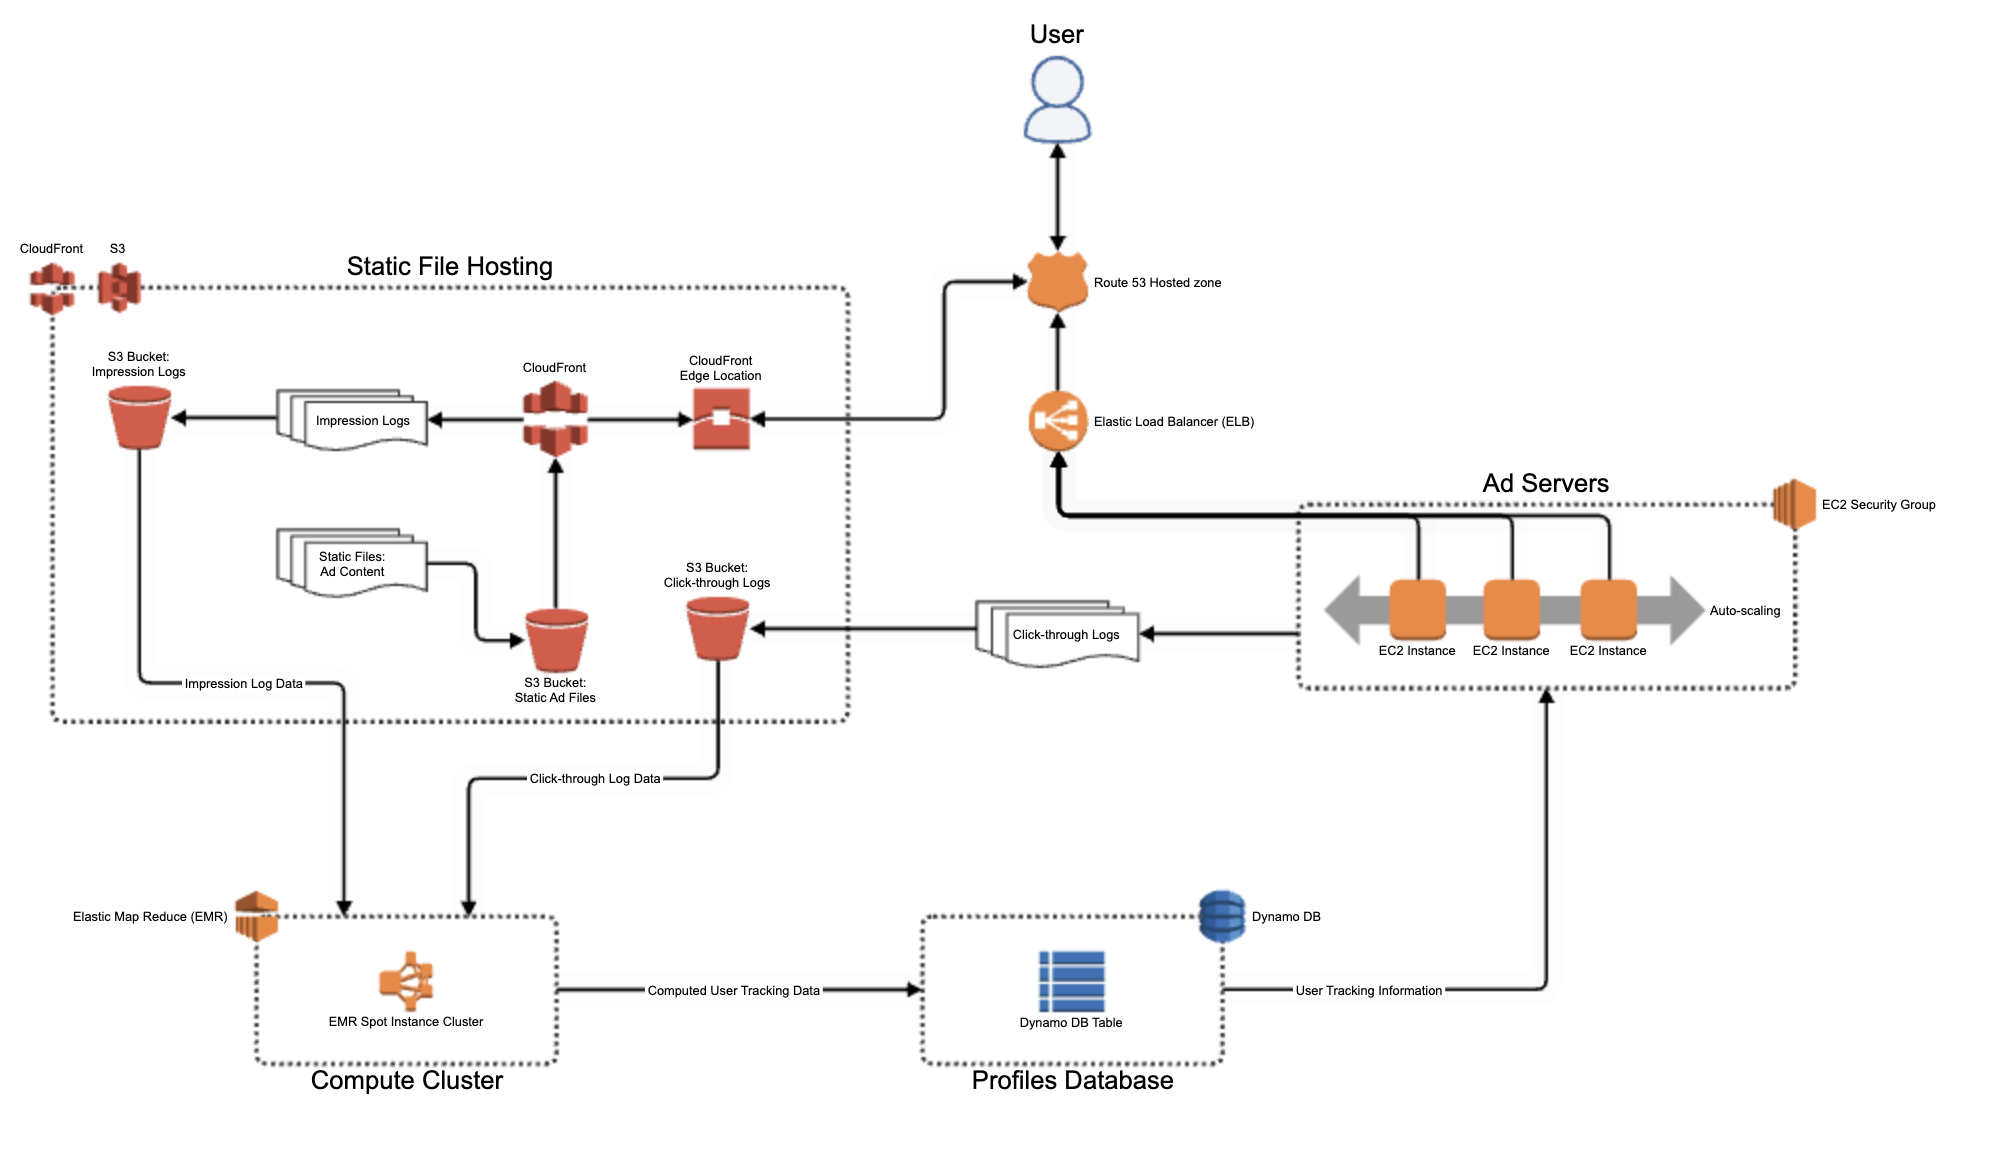
An AWS diagram visual representation of the architecture and components of a network deployed on AWS. It illustrates how various AWS services, resources, and components interact and are connected within a cloud environment.
This particular AWS network diagram example depicts ad serving architecture, but all types of applications run on AWS networks with varying structures.
To learn more about AWS architecture diagramming, visit our guide to AWS diagrams or learn more about AWS diagramming symbols.
Google Cloud Platform Network Diagram
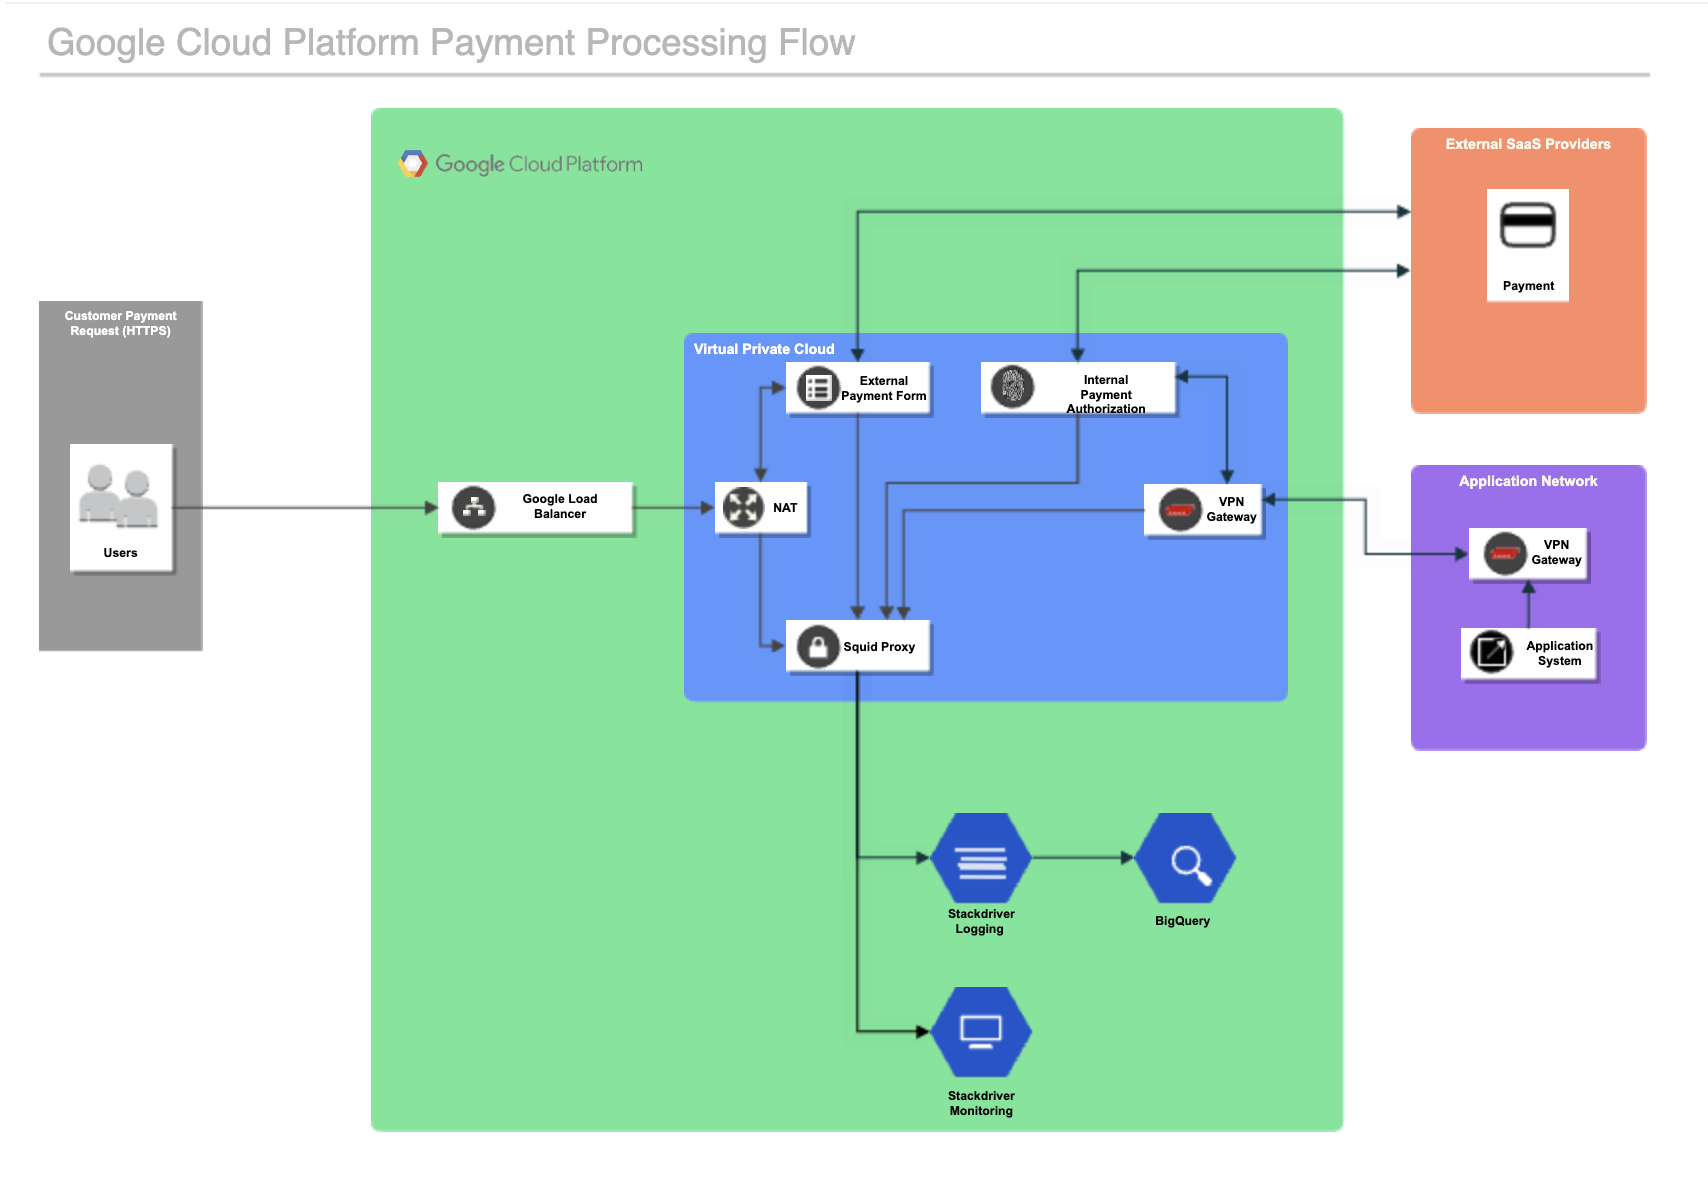
A Google Cloud Platform, or GCP, network diagram is a visual representation of the architecture, components, and connections within a network deployed on Google Cloud. It helps illustrate how various GCP services and resources interact, providing a clear overview of the cloud infrastructure.
This example shows a payment processing flow that uses Google Cloud. It includes the flow of information from the user’s input through the virtual private cloud and interactions with external providers and application networks.
Want more tips on visualizing Google Cloud architecture? Check out our comprehensive guide to GCP architecture diagrams.
Back to topTools for Creating Network Diagrams
A well-crafted diagram turns complexity into clarity. It helps you pinpoint inefficiencies, optimize security, and ensure your setup scales to meet growth.
By making Gliffy your network diagramming tool, you can create network diagrams directly in Confluence, helping you simplify troubleshooting by isolating issues quickly and enabling smarter decision-making with a detailed view of your system.
Now is the time to put the power of network diagrams to work for your organization. Explore your systems, identify opportunities for improvement, and start creating diagrams that drive smarter designs and strategies with Gliffy.
Related resources: