Whether your business has 500 or 5 employees, there will come a time when you’ll need to discuss a plan or present information. When that time comes, you should turn to diagrams.
Throughout history, diagrams have helped consolidate and effectively present information. Over time, many different types of diagrams developed, each with a specific and effective use case.
To help make sure you choose the right type of diagram for your needs, we’ll take you through a comprehensive rundown of different possible business diagrams and what each one is best suited for. Regardless of the type of diagram, getting a clear representation of a process can help improve team productivity and create efficiency.
Back to topUse Business Flowcharts to Map a Process
Flowcharts are all about breaking down relationships into their component parts. When trying to clarify or document relationships between people, processes or sets of data, a flow chart will help show that visually.
A great business use case is how content marketing agency Animalz shows their internal article pipeline process.
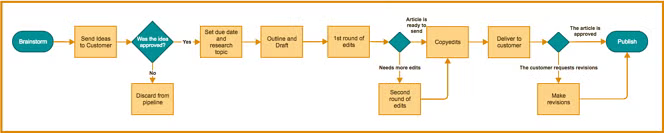
Each article goes through a process starting with the creation of the idea, to the actual writing and revision, before it’s sent to the customer for approval and publication. Though it might not be immediately obvious, like every good flowchart, this chart explains the Who, What, Where, and How and helps analyze the Why.
- Who: The Animalz Team
- What: Writing and publication of articles
- Where: Internal to External
- How: Via multiple rounds of feedback and editing
- Why: To populate the internet with great content!
Each flowchart will have a clear start and end point. So every process you document should have a very distinct beginning and end. Make sure you also take the time to familiarize yourself with flowchart symbols so that you present information in the best way with your chart.
Back to top
Use Cross-Functional Flowcharts Show High-Level Processes and Functions
Cross-functional flowcharts are particularly powerful in business use cases because they add an extra dimension of showing relationships between different functional units. These functional units can be departments or different teams involved in a process.
For example, if you needed to show potential investors or new board members how your company works, you can use a cross-functional flowchart to show how different department workflows connect.
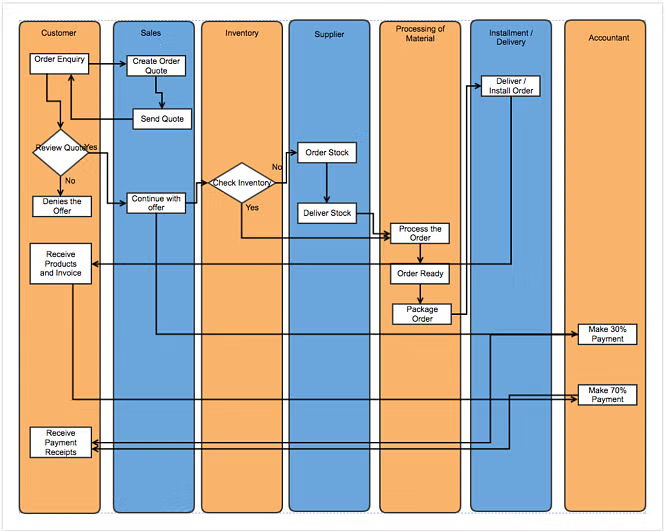
Detailing the exact movement of a product from order placement to delivery and showing who is responsible for each step keeps your whole team on the same page so that nothing falls through the cracks. This type of flowchart is ideal for a wide range of cross-team processes such as:
- Recruitment management
- New employee onboarding
- Complaint and problem processing
Back to top
Mind-Mapping Helps Brainstorm Ideas
If you find that you don’t have a beginning and end point you can use to shape your flowchart, you might need a mindmap. Mindmaps help organize and keep track of thoughts. You organize maps into idea clusters, but everything centers around a main topic.
For example, if your business wants to develop a new feature or product, you’ll need to figure out how you’re going to market it. A mindmap can help you organize all the different possible routes to take and exactly what each route will entail.
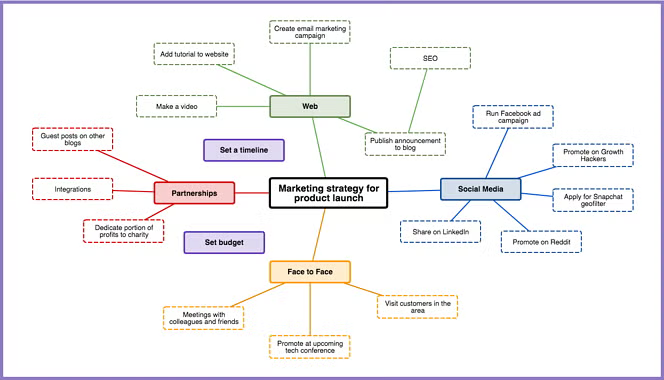
Once you’ve decided on which marketing strategies to go with, you can then use something like a flowchart to detail out how you’ll execute on each strategy.
Back to topFishbone Diagrams Identify Cause and Effect
As your business grows, it becomes harder to keep track of every moving piece at the same time. When you run into a problem, whether it’s a defect in a range of products or not having met your MRR goal for a few months, a fishbone diagram can help you break down and trace the cause of the problem back to the source.
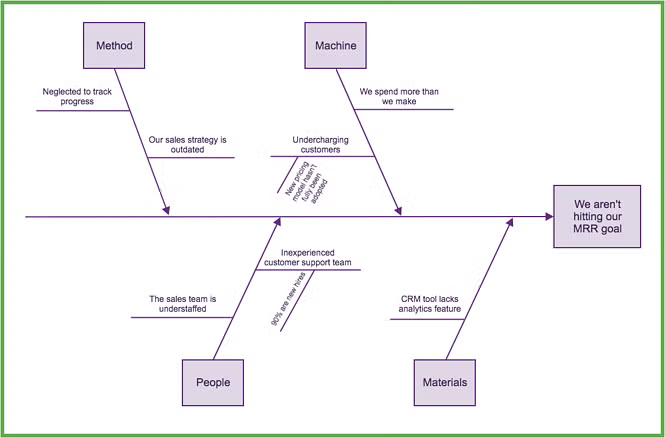
The diagram leads to the main problem, placed at the end. Arrows lead to the main problem and represent the possible causes. Different causes usually involve categories like “People”, “Method”, “Material” and “Machine”.
If your company falls behind on their MRR goals you would be able build a fishbone diagram to see which factors had contributed to this failure.
Once you’ve determined the root of the problem, you can then come up with solutions and preventative actions so that it doesn’t occur again in the future. Then, a mindmap is a great place to start brainstorming solutions.
Back to topVenn Diagrams Provide Clear Comparisons
The choices you make define your business and as your company grows, you make a lot of them. Venn diagrams are a great way to compare two or more things.
For example, if you need to decide between two project management tools, Teamwork Projects and Trello, you'll want to see which one provides the features you need. If you're looking for a free plan with little commitment, a tool like Trello that lets you try before you buy, might be the right option for you. But if you're looking for a more powerful option that can really help your team manage everything from one place, Teamwork Projects may be the one you're looking for.
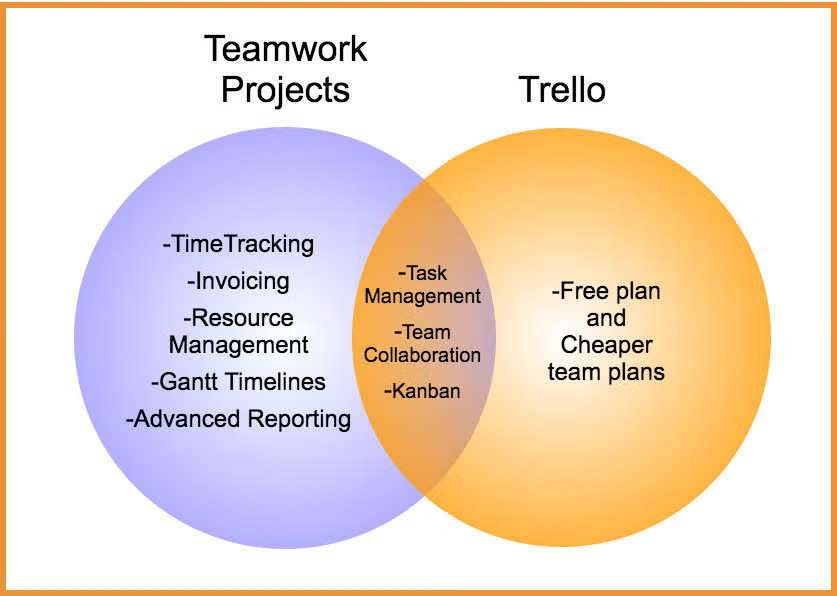
In every Venn diagram some features will overlap, but some won't and that's what makes the Venn diagram so useful.
Having this direct comparison can help you weigh the pros and cons of each option and ultimately go with the one that best fits your needs. Venn diagrams can compare any similar groups of information, and you may even discover that the things you compare aren't as similar as you once thought, helping to inform your decision.
Org Charts Map out Relationships and Roles
Also known as tree diagrams, organizational charts help explore a specific aspect of your company. Items ripple off the main stem like branches to show how everything relates back to the original topic. With these charts, you can show how everyone within a team works together, or how a project is broken down into parts and the steps related to each part.
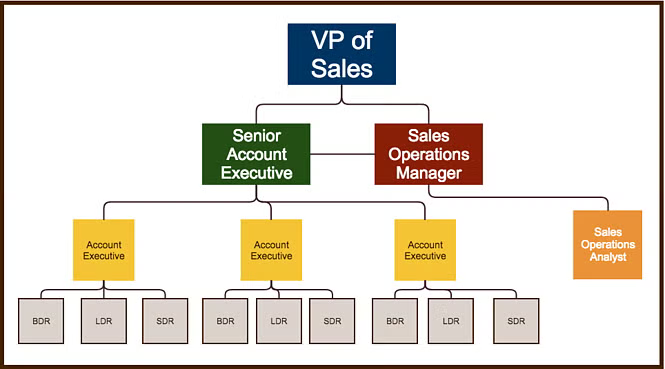
Not to be confused with mind maps, which also center ideas around a specific topic, tree diagrams have a more narrow focus and multiple branches that relate to each other, rather than having a single central topic with separate subtopics.
Back to topSWOT Diagrams Map out Goals
SWOT stands for internal factors, Strengths and Weaknesses, and external factors, Opportunities and Threats, that can have an effect on your goals. If you have a specific goal in mind that you wish to achieve, using SWOT analysis can help you map out each of the potential factors in these four categories that can help or hinder you in your journey. Once you've laid out every factor, you can then take everything into account to help develop the best strategy to meet your goal.
If you need to evaluate the current state of your product, or if you need to determine if a new product can help your company perform better, a SWOT diagram can help you break down whether it will be worth your time and money.
Above we can see an analysis of the BART train system. This can help management narrow down what improvements to make, and other cities can use this analysis to figure out what features to include when building their own train system.
When creating a SWOT chart, the more factors you include in your diagram the better. You want to make sure you take into account every possible SWOT so that you can prepare for the best and worst case scenarios.
Network Diagrams Detail out Computer Networks
Computer networks are all unique and are made up a number of different parts that keep everything together and running smoothly. Your company will likely have its own unique setup that will need to be maintained to make sure your business can continue growing. A Network Diagram is a great way to show how every part of your computer network interacts.
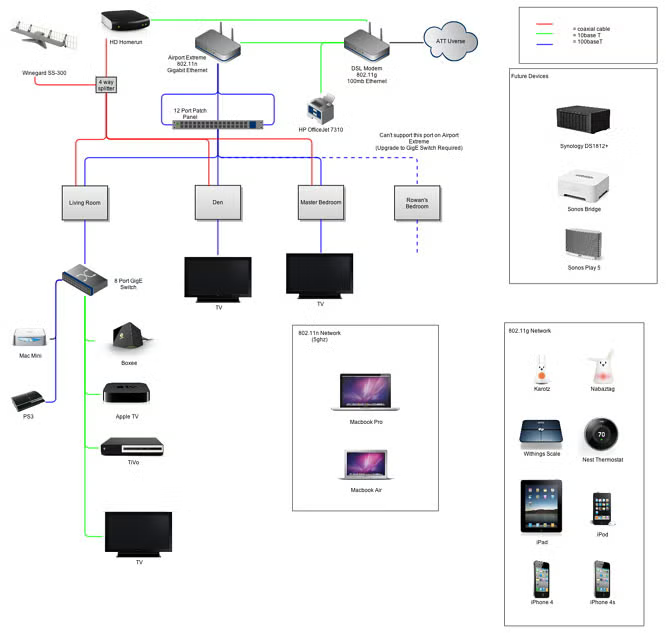
Keeping an up-to-date diagram will help ensure that you can track and troubleshoot any problems that come up. Make sure every component is accounted for so you're not scrambling to find what's missing when something goes awry.
Back to top
BPMN Diagrams Simplify Complex Business Processes
Though it may just look like a flowchart or even a cross-functional flowchart, Business Process Modeling Notation (BPMN) diagrams have a very specific function. These flowcharts visually depict the sequence of activities and information needed to conduct complex business processes in a simple way.
As with flowcharts, each specific element is represented by a different shape. Using these shapes to help differentiate different parts of the process helps simplify the process into an easy-to-understand diagram.
Back to topUML Diagrams Describe Technical Relationships
Centered around the Unified Modeling Language (UML), which is a standardized language accompanied by a specific set of symbols, these diagrams help software engineers and other fields that use the language depict complex processes in a simple way.
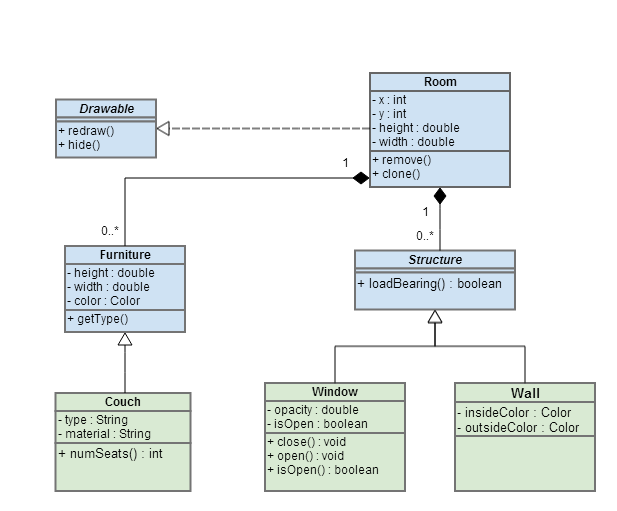
Though it may look confusing to those not familiar with the language, the diagrams should make understanding software design processes much easier.
Back to top
Wireframe Diagrams Build Your Website
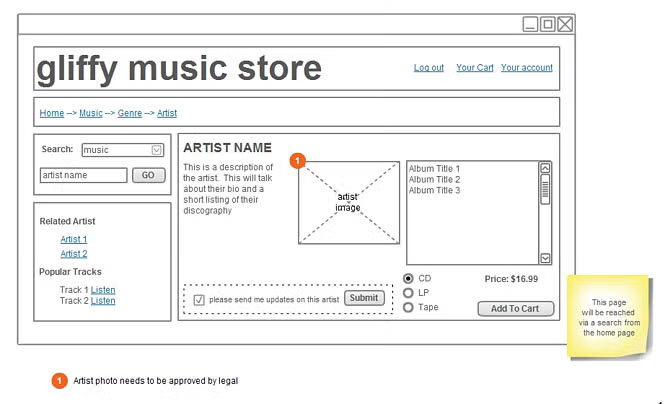
A bit different from all the diagrams we've discussed so far, but just as important, wireframe diagrams give you an outline of what you want your website to look like. Not only can it help you build a clearer vision for your site, but it can also help developers know what you want when you send them an idea.

Using a diagram can give you a clear picture of how every feature of your site will look in relation to one another. It can also help make sure every member of your team is on the same page about the site before it goes into development.
Back to top
Which Diagram Should You Use?
Each diagram presents its own unique format and use case. To help you figure out which diagram is the right one for your needs, we put together this flowchart.
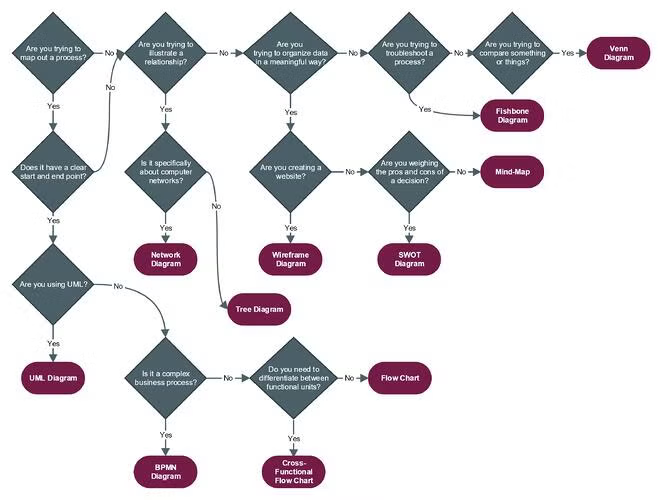
Once you've decided what type of diagram to make, get diagramming! Gliffy makes it easy to draw diagrams by dragging and dropping shapes in our intuitive diagramming app. You can learn more about our apps for Confluence, then get started with a free trial.