Unified Modeling Language, or UML, provides a standardized way for software developers and engineers to communicate about a system's structure and behavior without getting into the actual code.
There are, as of UML 2.5, fourteen officially recognized types of UML diagrams. These types get sorted into three buckets:
- Structure diagrams
- Behavioral diagrams
- Interaction diagrams (sometimes considered a subset of behavior diagrams)
This chart illustrates the UML diagram types that fall under each bucket.
Structure Diagrams | Behavioral Diagrams | Interaction Diagrams |
|
|
|
You can access UML diagram templates by creating a Confluence diagram with Gliffy and selecting "Software Design & UML" from the "Templates" list. But before that, you'll need to make sure you've started your free trial!
Back to topUML Structure Diagram Types and Templates for UML Diagrams
Structure diagrams depict the static elements of your application (its parts and how they relate).
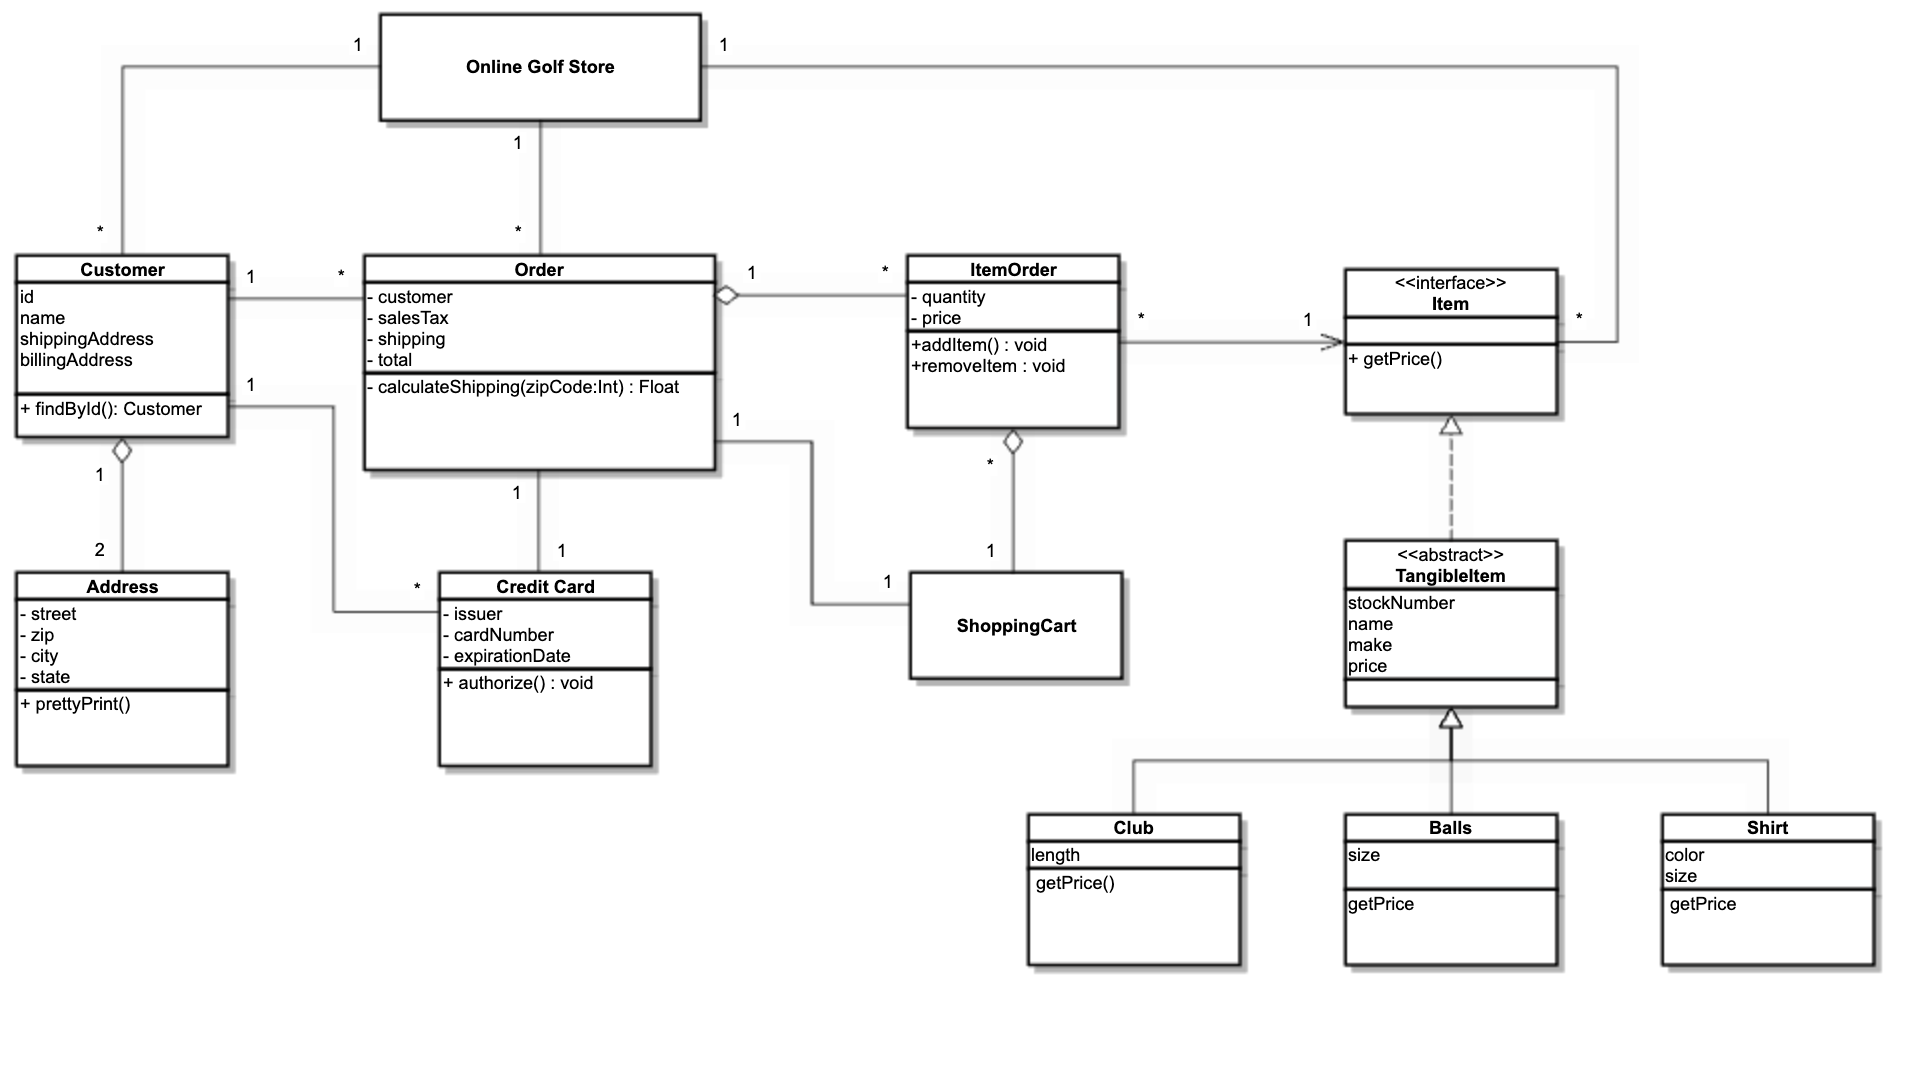
Class Diagrams
The primary function of a class diagram is to map out the static structure of an application using classes and interfaces. With an overview of the project as a collection of static elements, developers and architects gain a clear understanding of the system's architecture before a single line of code is written.
Class diagrams are versatile and essential across various stages of software development:
- Application Design & Analysis: During the initial design phase, they help architects sketch out the system's logical structure, ensuring all requirements are met before implementation begins.
- Project Alignment: By simplifying complex structures in the form of a diagram, you can easily communicate them to technical and non-technical stakeholders throughout the business.
- Refactoring Legacy Code: When updating or maintaining older systems, reverse-engineering code into a class diagram provides immediate insight into the existing architecture, highlighting areas for improvement.
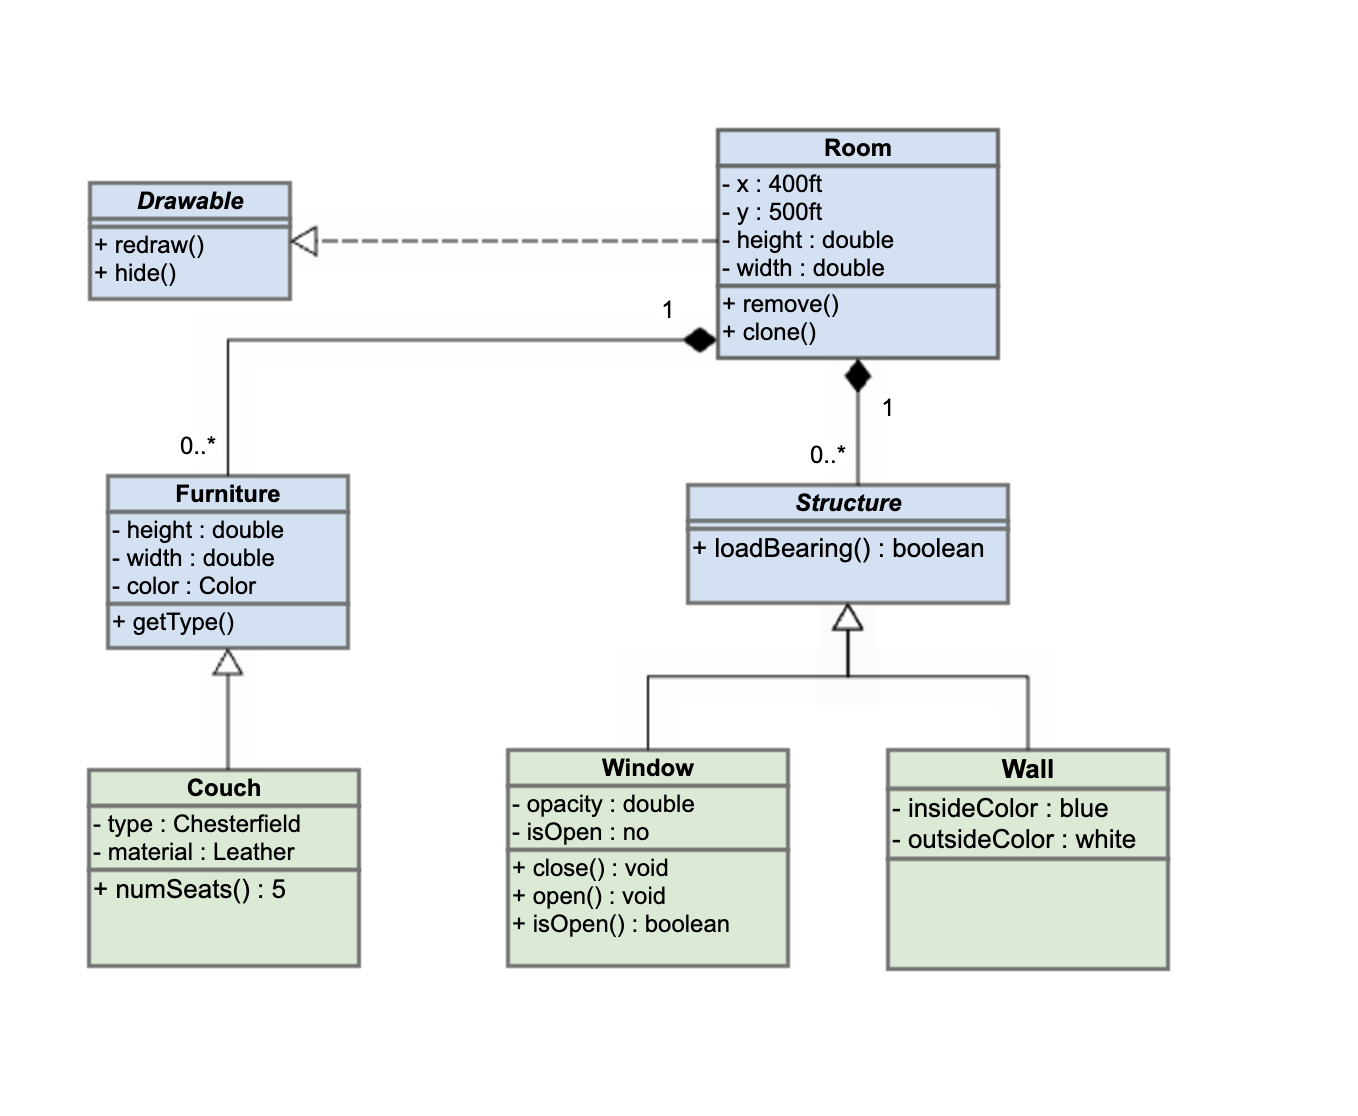
Object Diagrams
Object diagrams are akin to class diagrams, but drilled down to the instance-specific level. They’re like a snapshot of the system’s structure taken at a specific point of operation, bridging the gap between abstract design and runtime reality.
These diagrams are essential for:
- Visualizing Runtime Scenarios: They capture the state of a system at a particular point in time, showing exactly which objects exist and how they are connected.
- Debugging and Analysis: By modeling specific data values and links, they help developers trace errors and understand complex object relationships that may not be obvious in a static class diagram.
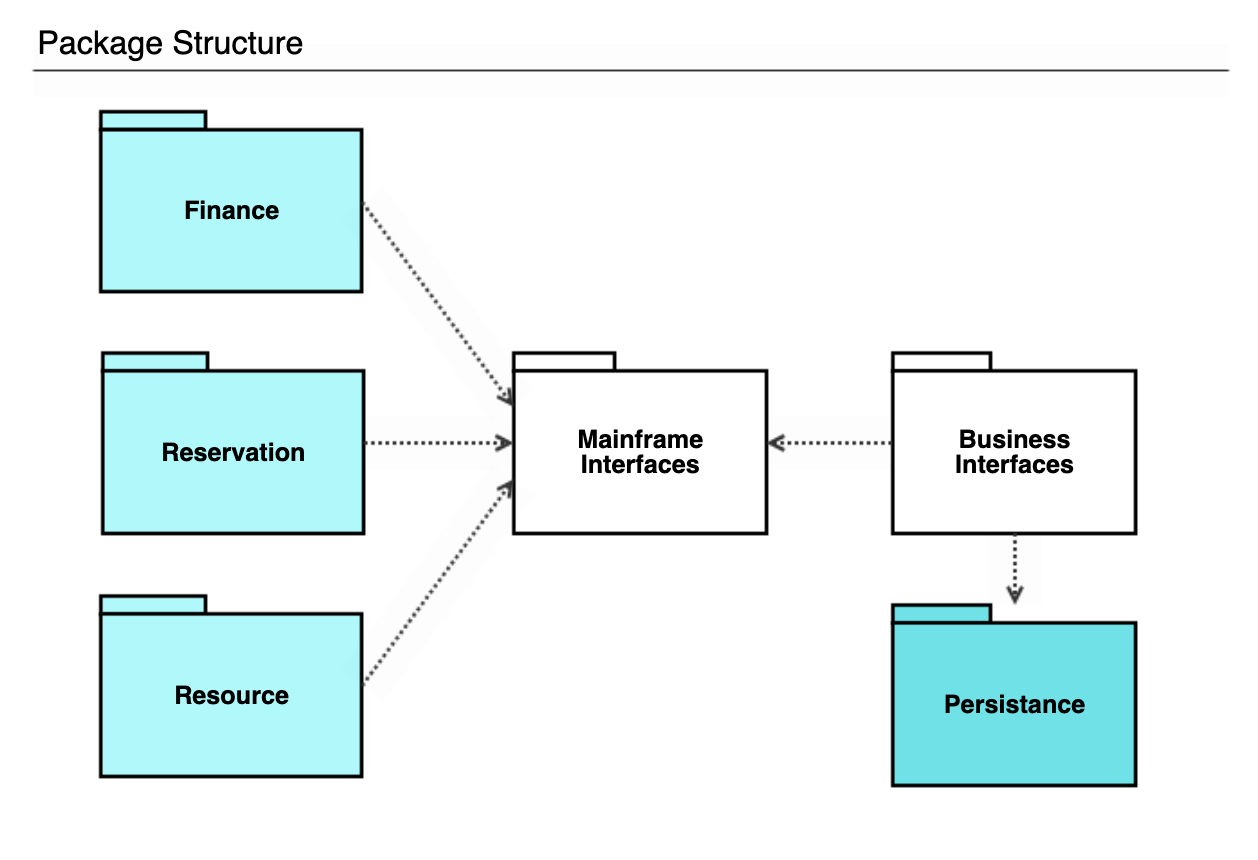
Package Diagrams
UML package diagrams show system elements split into packages connected by inter-package relationships. They can be considered class diagrams with a level of compartmentalization added to help designers minimize dependencies.
With the help of a package diagram, you achieve:
- High-Level Abstraction: View the system from 30,000 feet, ignoring low-level details to focus on architectural relationships.
- Dependency Management: Visualize dependencies between packages (such as imports or access), helping architects identify potential circular dependencies or tight coupling that could hinder maintainability.
- Namespace Control: Define clear namespaces, preventing naming conflicts in large projects where multiple classes might share the same name but serve different functions.
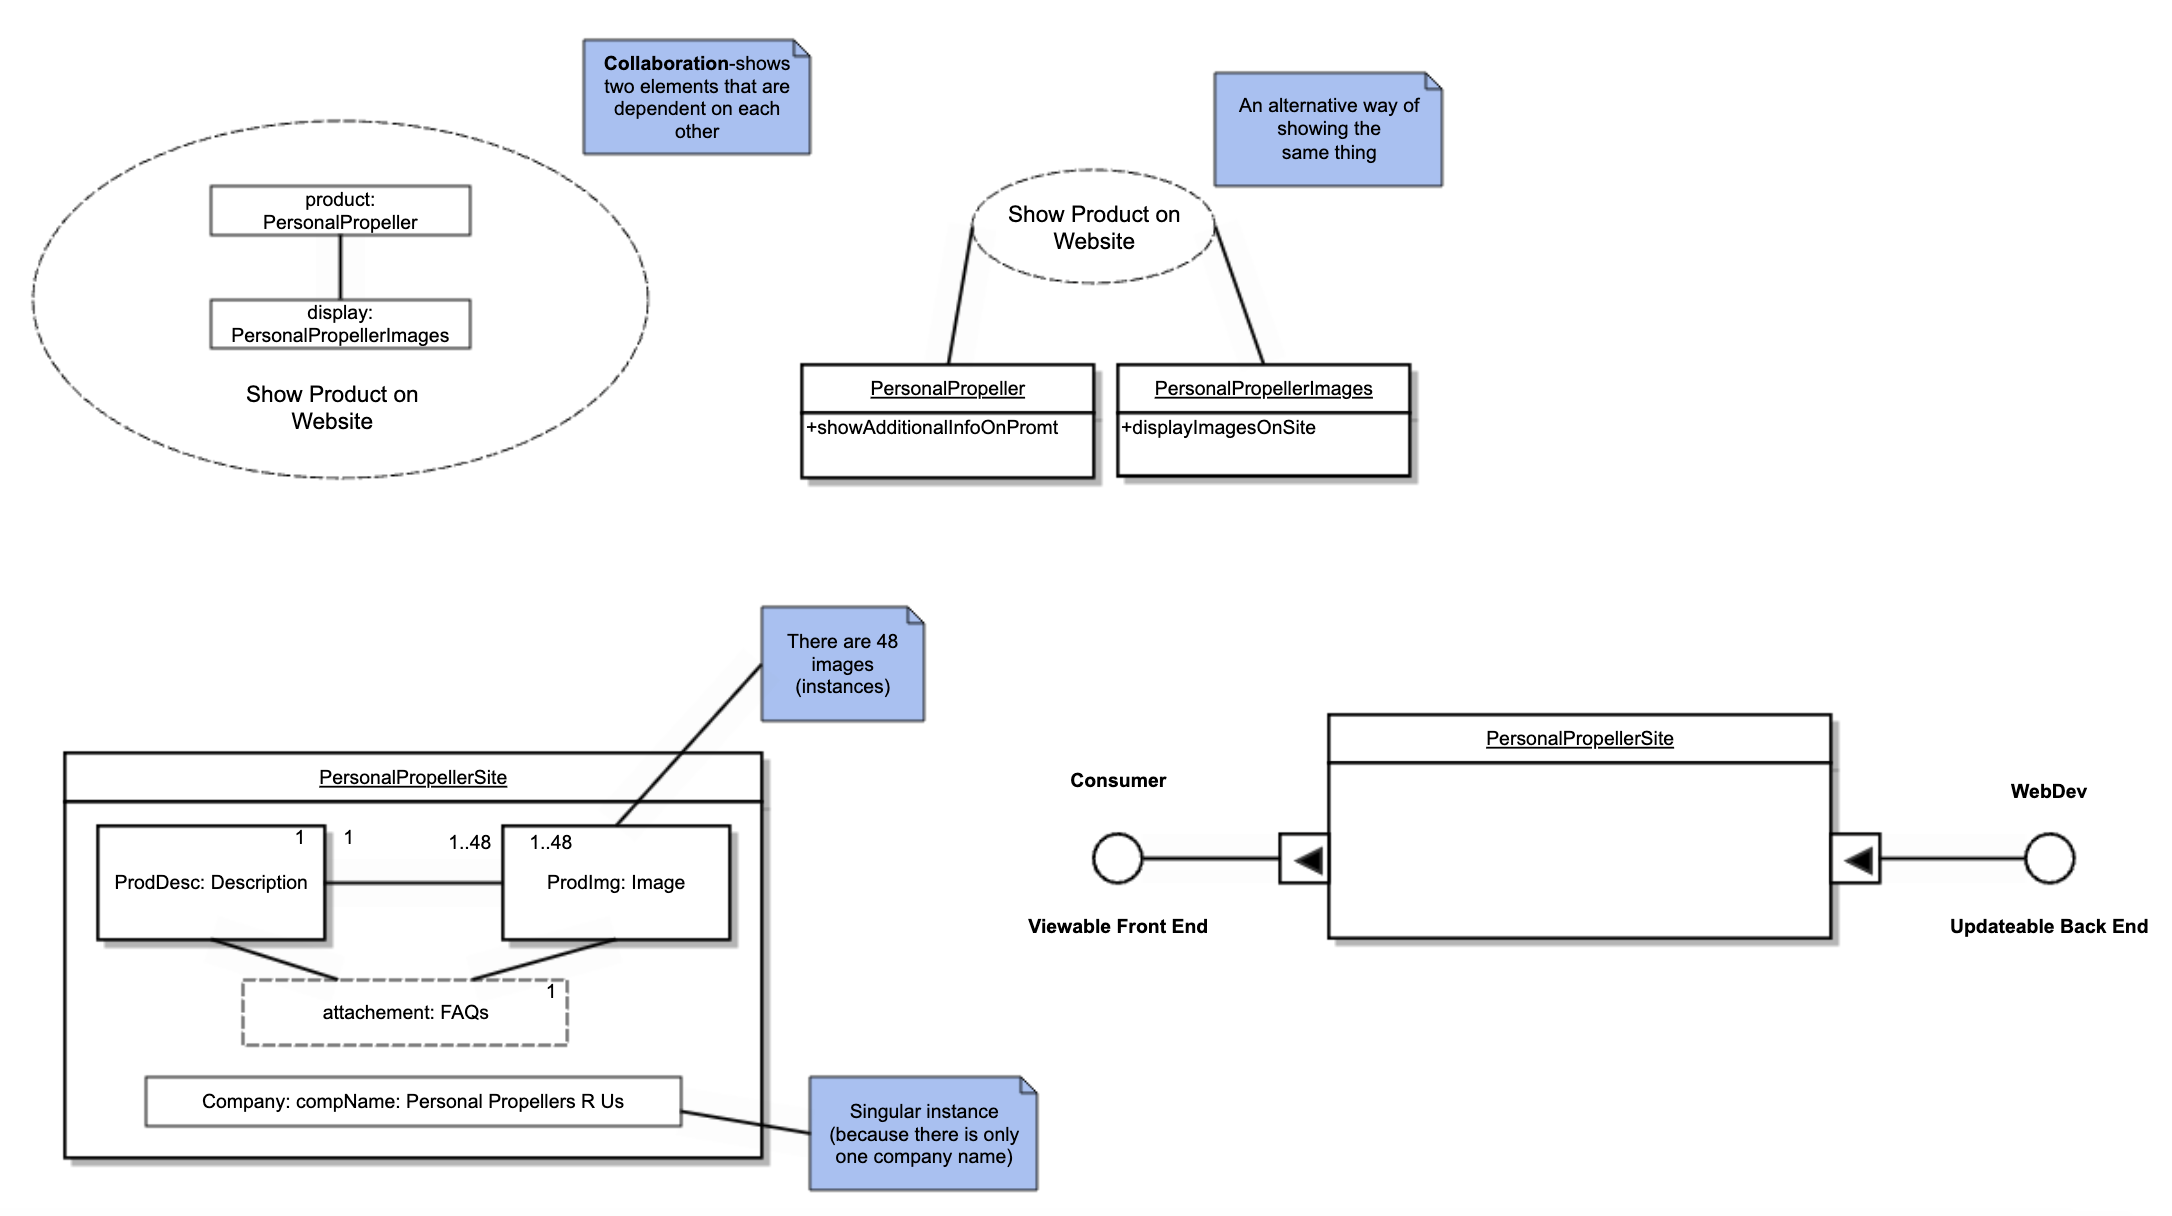
Composite Structure Diagrams
There are two types of composite structure diagrams:
- Internal structure diagrams, which break classifiers down into properties, parts, and relationships.
- Collaboration use diagrams, which show how system objects cooperate to produce a combined behavior within the system.
Internal structure UML diagrams are used to model the internal structure of a system or a class, showing how its parts interact to achieve a specific behavior.
Collaboration use diagrams provide a detailed view of the relationships between the components within a system, focusing on the collaboration and connections between objects, parts, and roles.
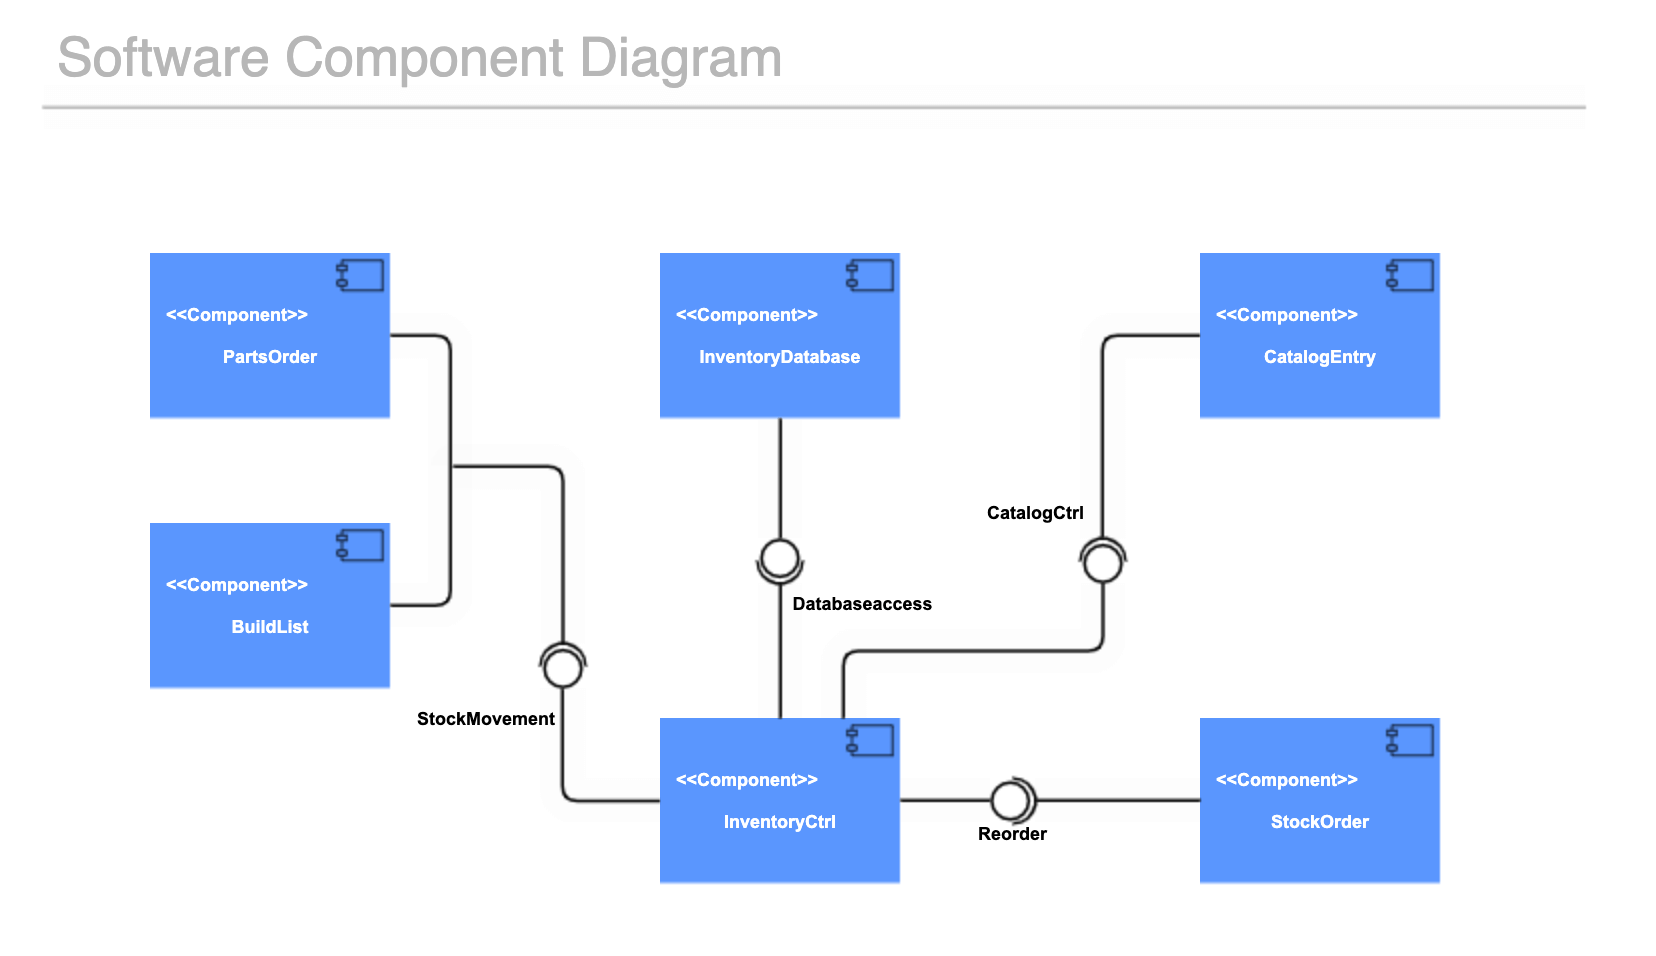
Component Diagrams
By showing the relationships between a system’s components structurally rather than behaviorally, UML component diagrams help architects and developers understand the service-oriented view of a system. This ensures that the system's architecture is modular, scalable, and easy to maintain.
Their primary applications include:
- Visualizing Subsystems: Component diagrams are ideal for modeling subsystems and their relationships, showing how different parts of the application interact with each other.
- Planning Development Work: By illustrating the dependencies between components, project managers can better plan and allocate development tasks, as teams can work on different components in parallel.
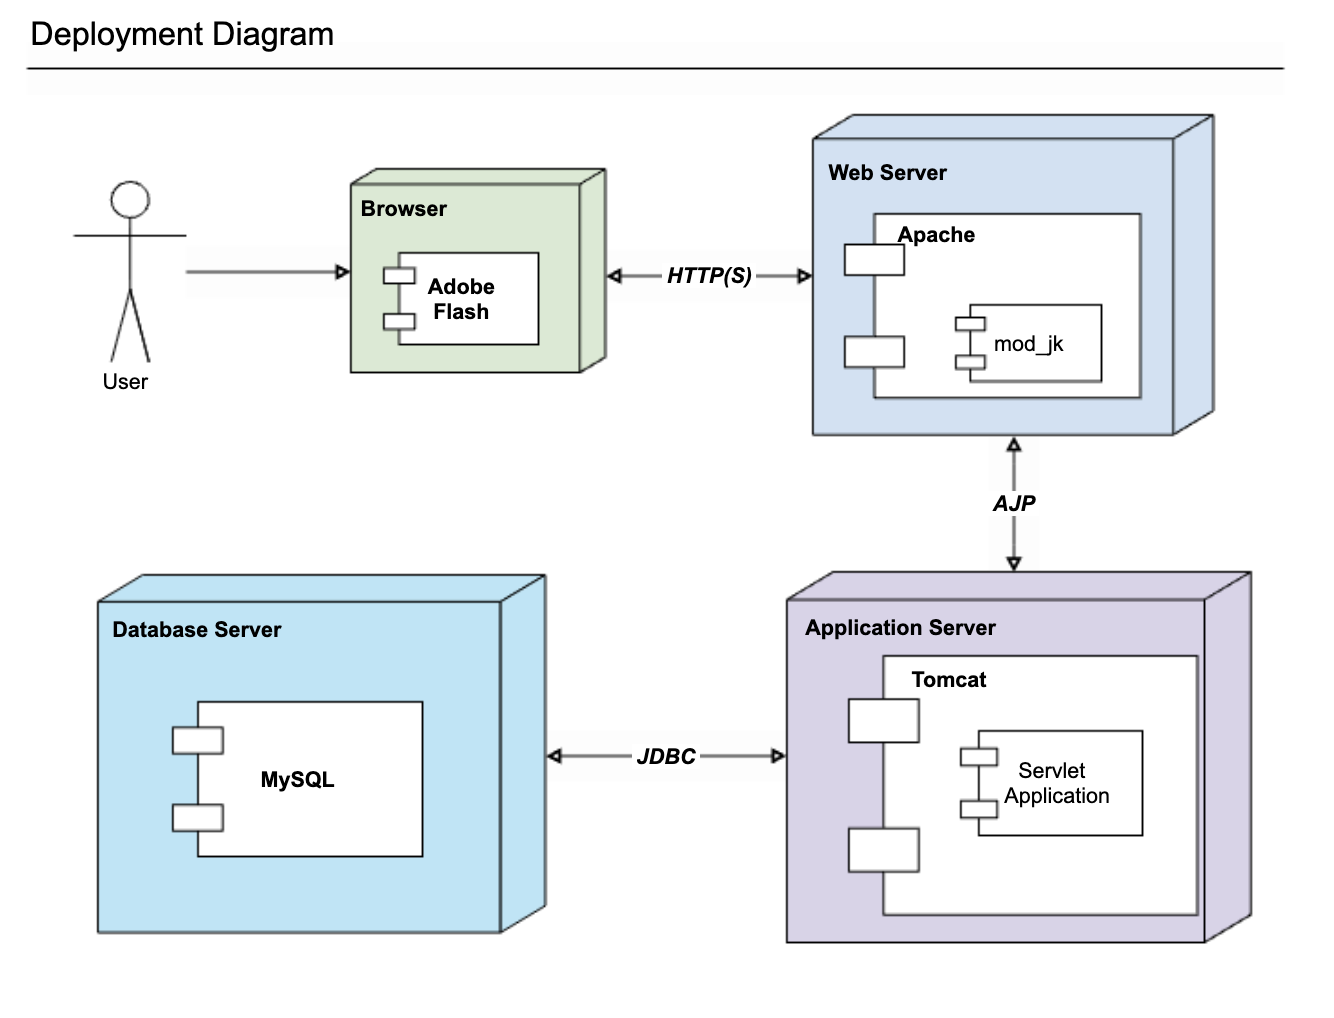
Deployment Diagrams
Deployment diagrams map out the physical deployment of artifacts (software components) on nodes (hardware components), so you can see which pieces of software live on which pieces of hardware and how those artifacts on nodes interrelate.
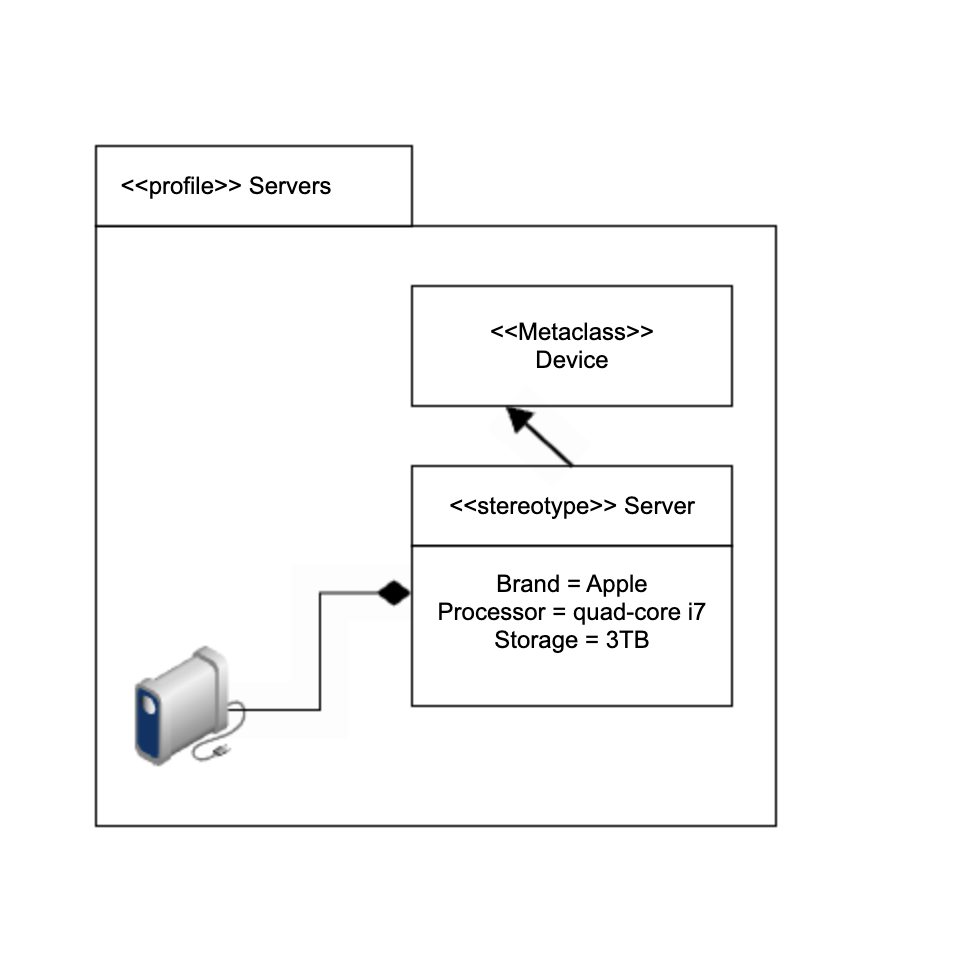
Profile Diagrams
Profile diagrams extend UML by allowing you to define stereotypes, tagged values, and constraints as a means of adapting the UML metamodel for different domains and platforms.
By creating custom profiles, teams can introduce new modeling elements and semantics that are not available in the standard UML specification. This ensures that models are not only syntactically correct but also semantically aligned with a specific technology stack, industry standard, or architectural framework.
 Back to top
UML Behavioral Diagram Types and Templates
Behavioral (or behavior) and interaction diagrams illustrate different aspects of your system’s dynamic functionality—how the objects in the system change over time.
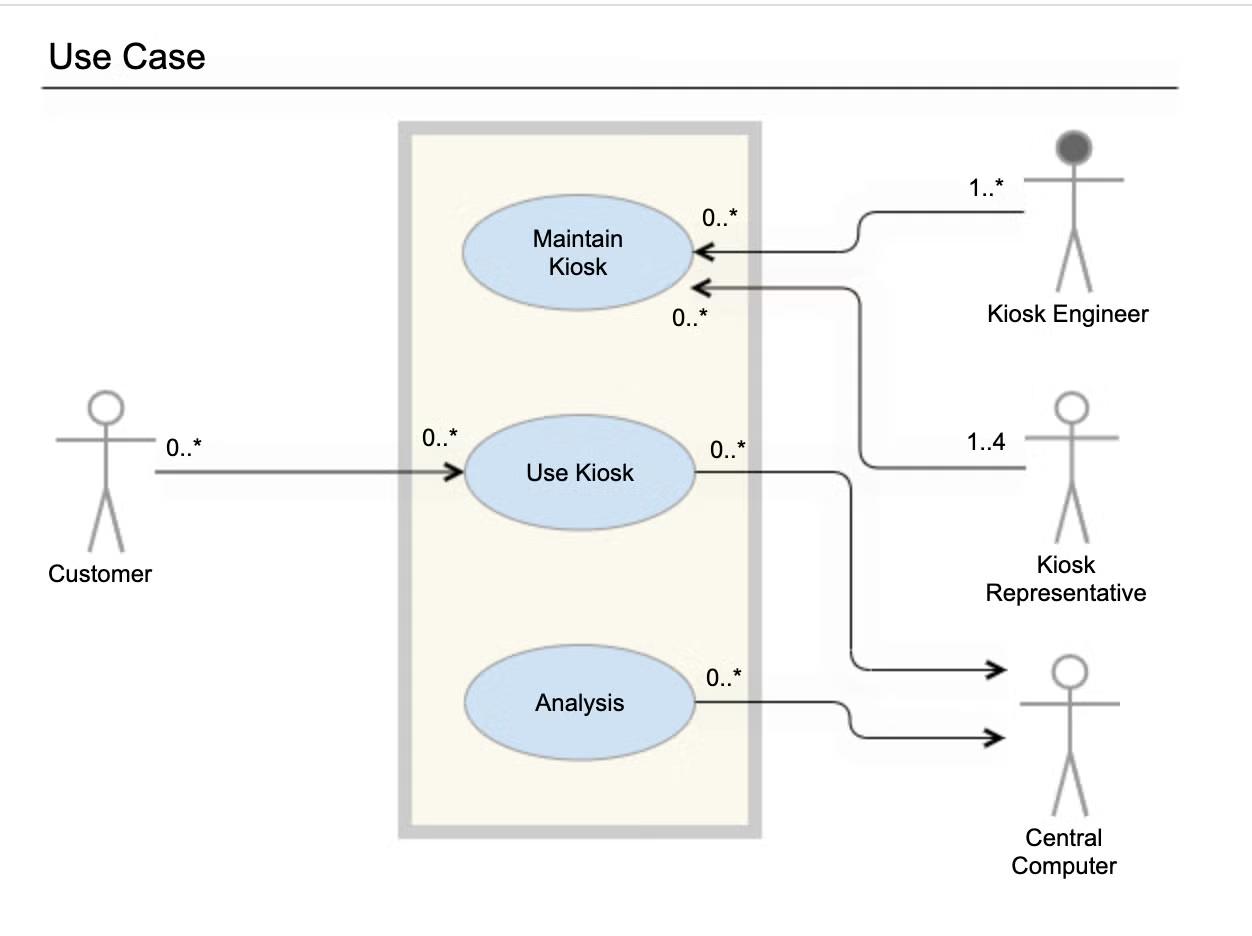
Use Case Diagrams
Use case diagrams are critical for successful project planning and scope management. Their strategic value is demonstrated across several key areas:
- Functionality Analysis: They serve as the blueprint for functional requirements without getting into the specifics of how those functionalities are implemented on a technical level.
- System Scope Definition: By clearly defining the system boundary, they help project managers prevent scope creep by explicitly visualizing what is inside the system (and therefore being built) and what remains external.
- Stakeholder Communication: Because of their simplicity and lack of technical jargon, use case diagrams are the perfect tool for communicating system behavior to non-technical stakeholders, ensuring alignment on deliverables.
Use Case Diagram Video Tutorial
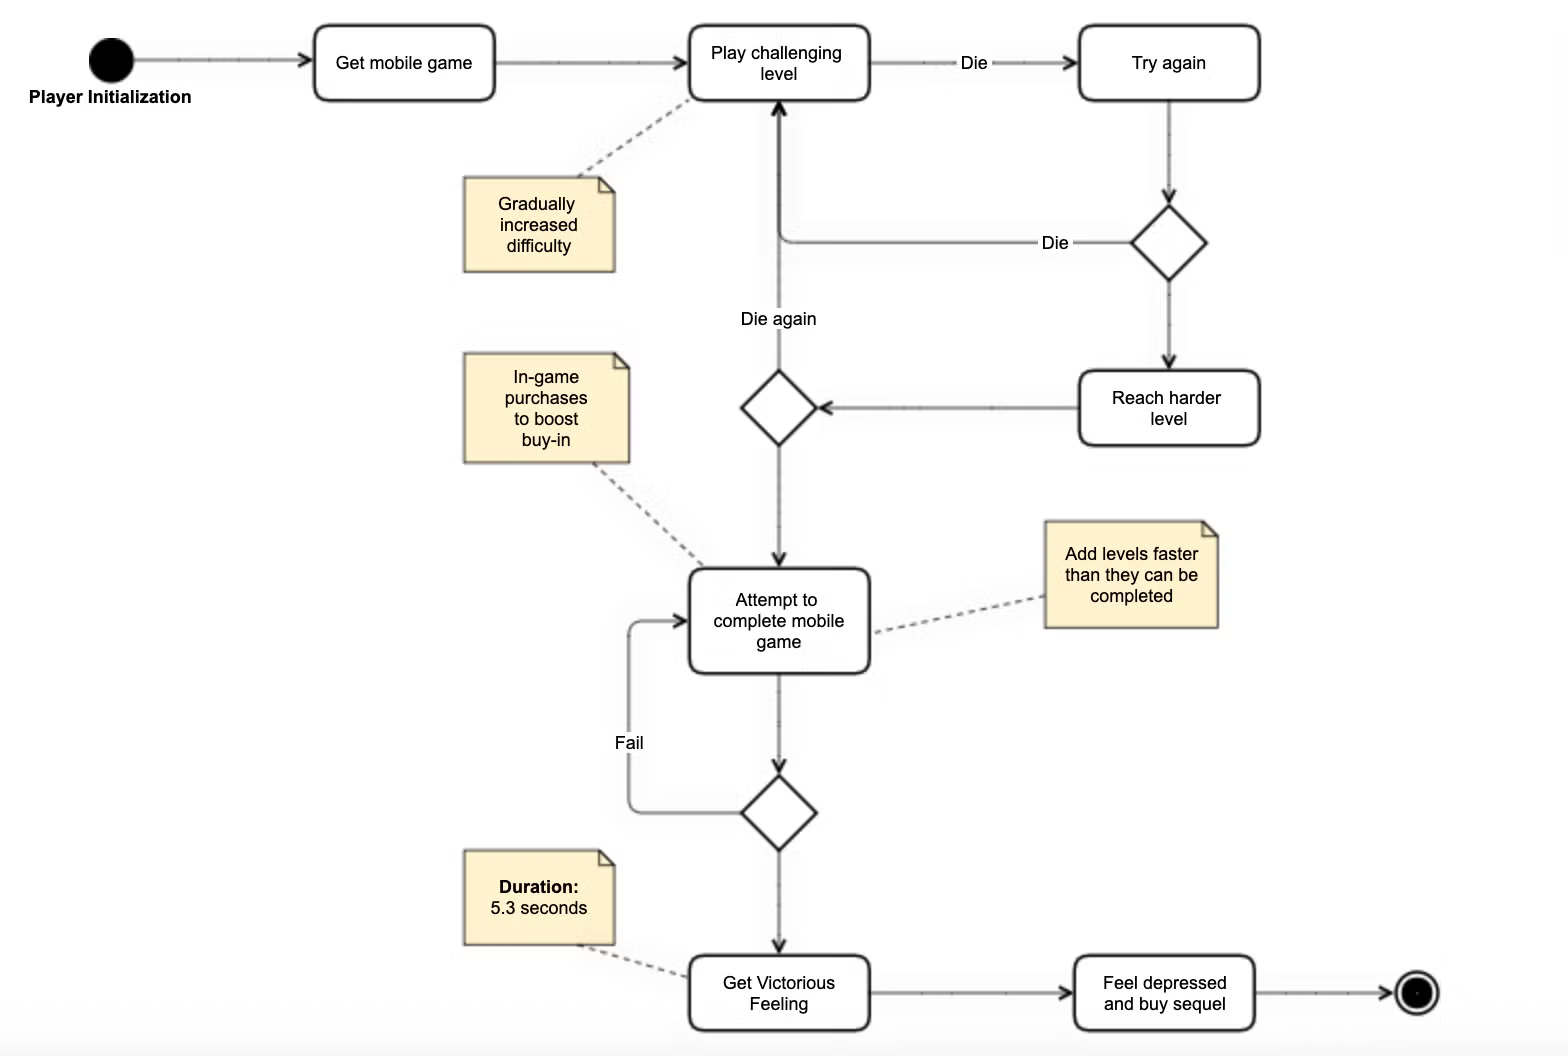
Activity Diagrams
Activity diagrams are UML's version of the flowchart. They illustrate workflows as sequences of activities and actions, revealing how control flows dynamically through a system in response to operations performed on classes in the system.
This clarity ensures that all stakeholders—from business analysts to developers—share a unified understanding of the system's operational logic.
They’re useful throughout different stages of developing a system:
- Requirements Gathering: They can be used to represent the different use cases of a system during the planning phase.
- System Logic Visualization: Developers use them to design the internal logic of complex operations, ensuring that conditional branches, loops, and error-handling paths are correctly structured.
- Use Case Elaboration: They provide the granular detail needed to flesh out high-level use cases, showing exactly how the system responds to various user inputs and scenarios step-by-step.
Activity Diagram Video Tutorial
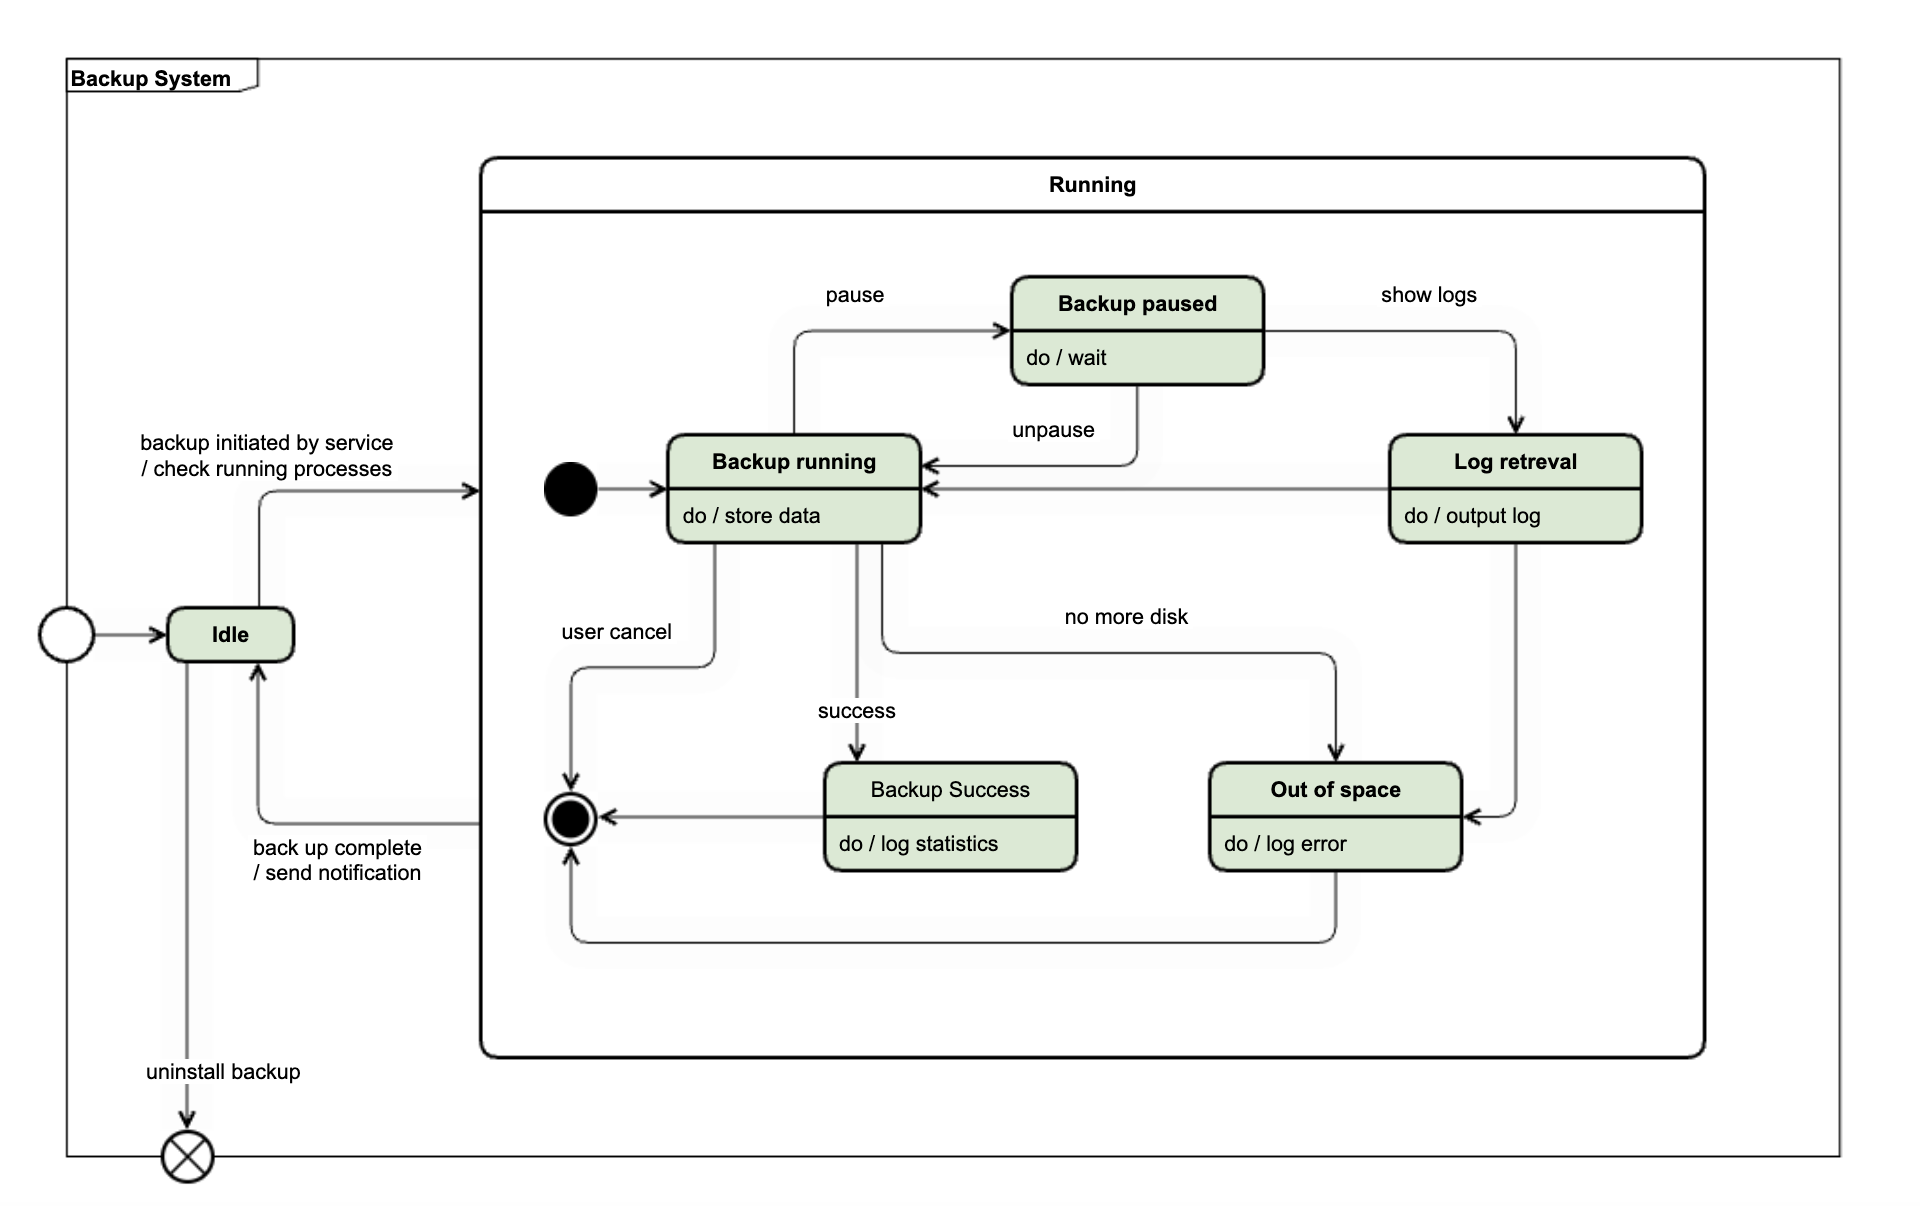
State Machine Diagrams
State machine diagrams or state diagrams model system behavior over a number of transitions so that the designer can see the singular ‘state’ of the system at any point given the indicated external stimuli.
State Machine Diagram Tutorial
UML Interaction Diagram Types and Templates
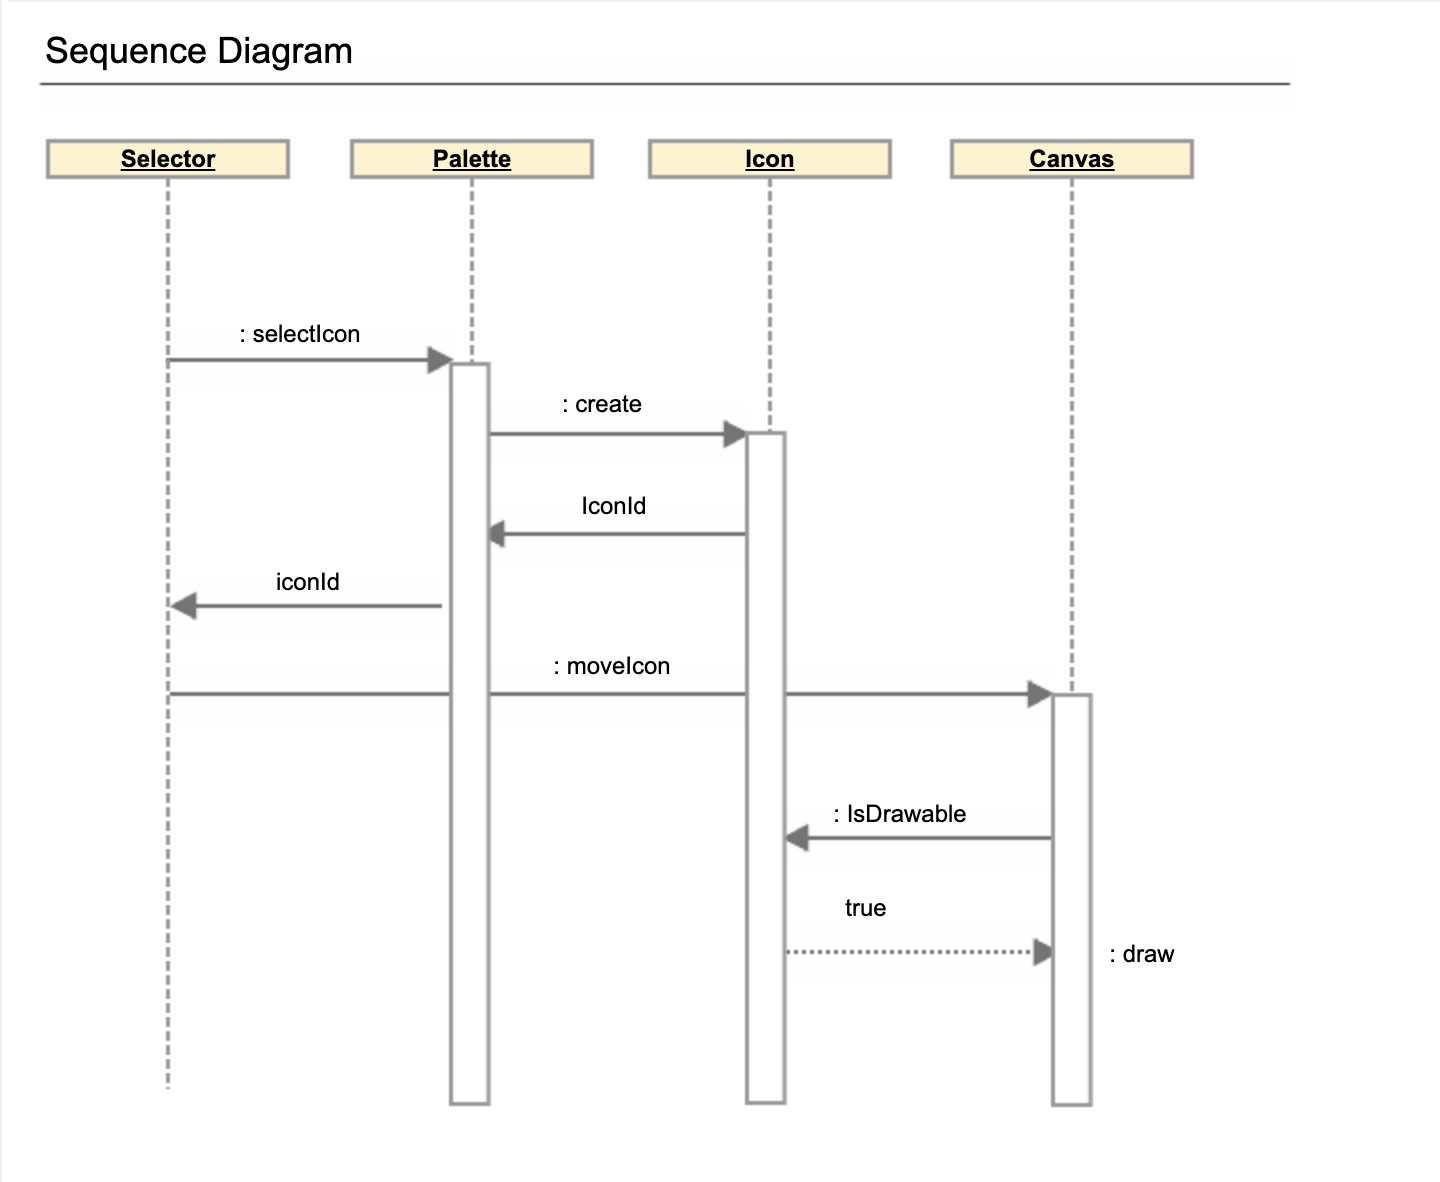
Sequence Diagrams
A sequence diagram, sometimes called an event diagram, illustrates the interactions between objects in chronological order. Sequence diagrams are exceptionally useful for a variety of tasks in software engineering and business analysis:
- Designing Complex Scenarios: Developers use sequence diagrams to map out the step-by-step logic for a function or service, ensuring all required interactions between objects are accounted for before implementation.
- Understanding Existing Code: When analyzing a complex or legacy system, a sequence diagram can reverse-engineer the interactions, making it easier to understand how different parts of the system collaborate to achieve a result.
- Business Process Modeling: Business analysts can use sequence diagrams to model how different actors or systems interact in a business process, helping to identify bottlenecks or inefficiencies.
Sequence Diagram Video Tutorial
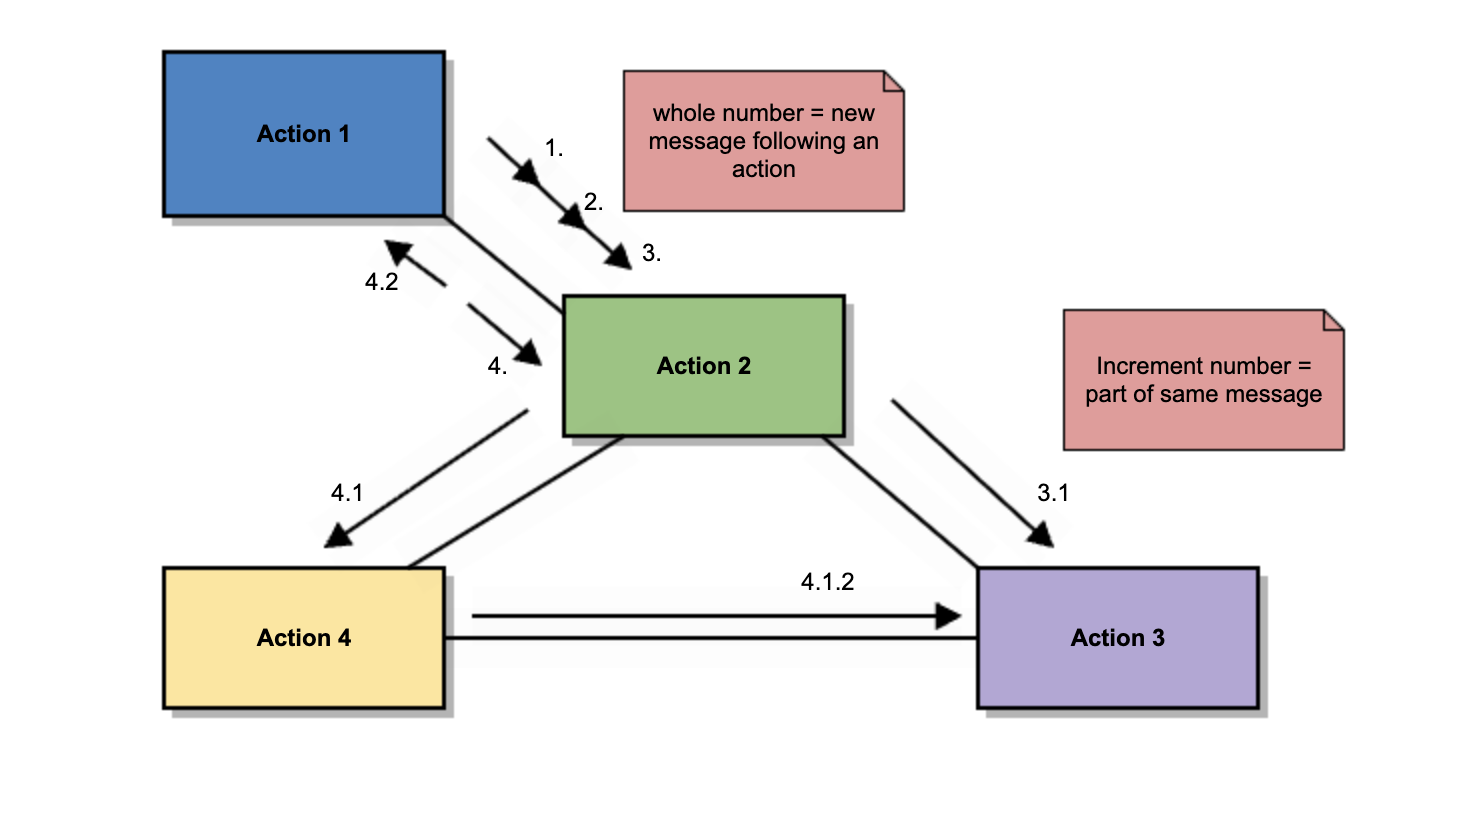
Communication Diagrams
Communication diagrams (aka collaboration diagrams) are interaction diagrams that center on architecture and how internal structure corresponds to the passing of messages.
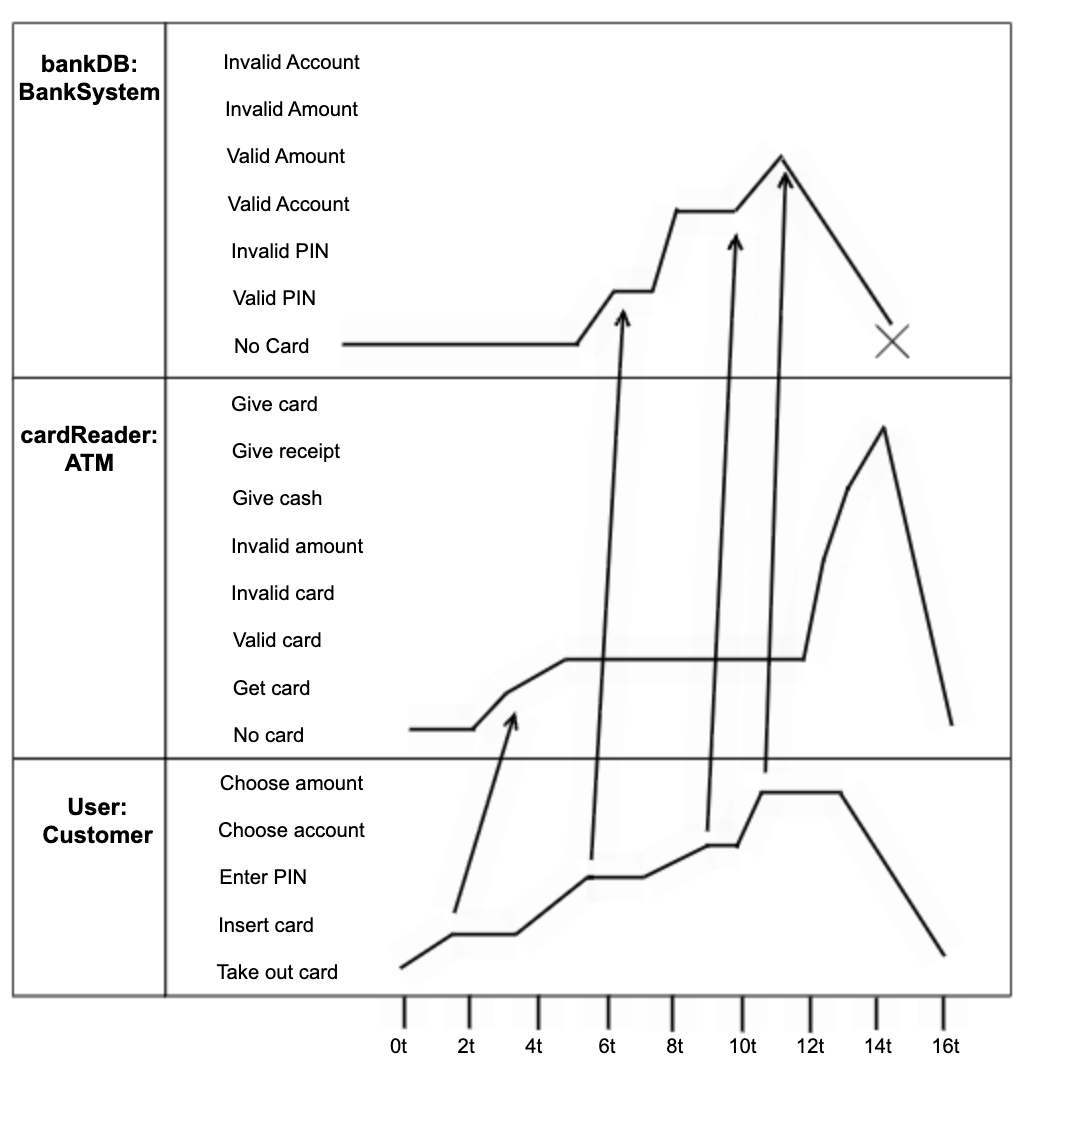
Timing Diagrams
Timing diagrams are sequence diagrams that focus on how objects behave over defined increments of time. In timing diagrams, time is plotted along the horizontal axis in specified units so you can see what is meant to occur in the 4th millisecond, minute, or month of operation.
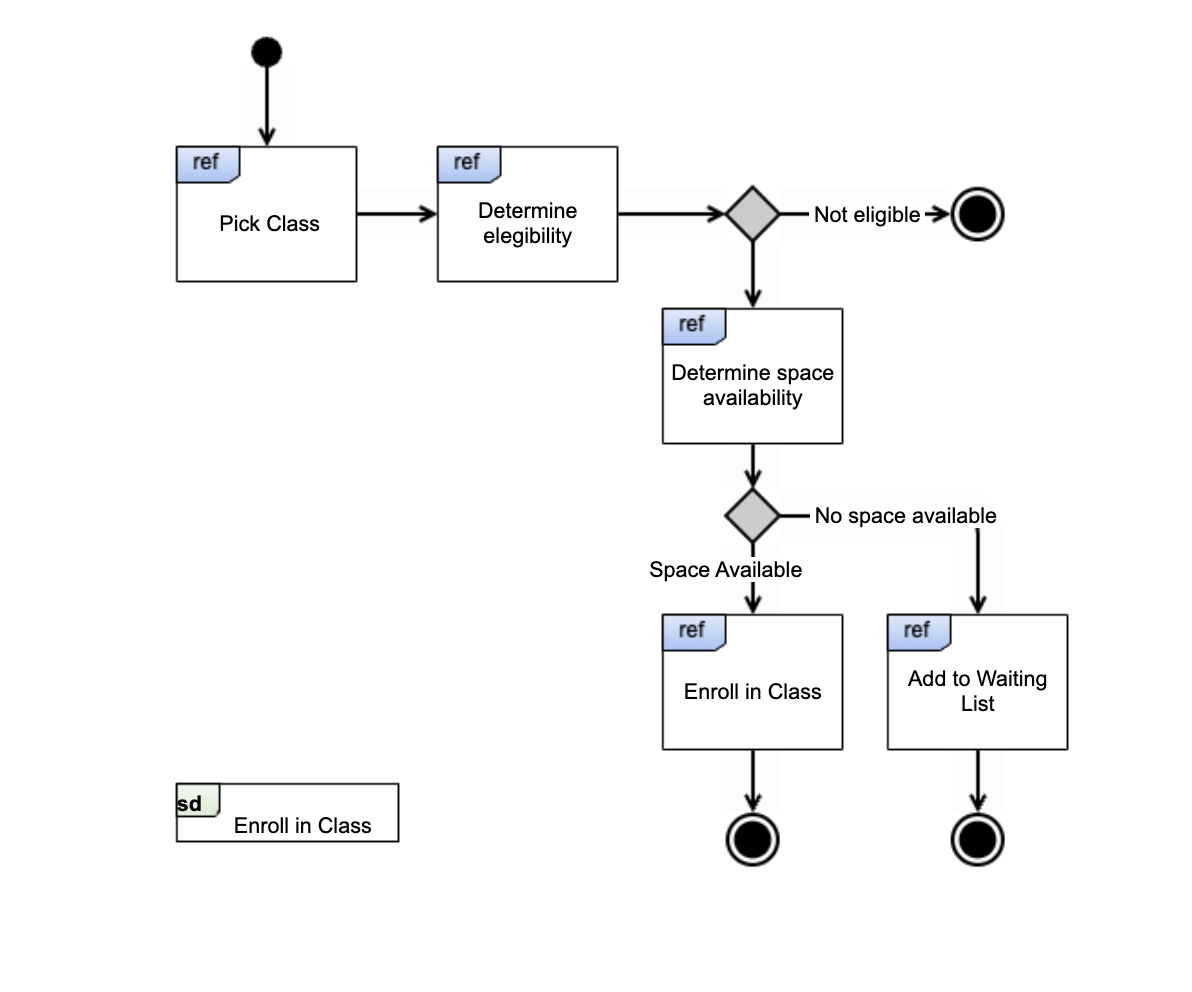
Interaction Overview Diagrams
Interaction overview diagrams combine the activity diagram type with that of an interaction diagram so that a sequence of activities gets broken into discrete activities. Each activity gets compartmentalized within a frame, which in turn contains an interaction diagram or diagrams. This form helps to distill complex scenarios so they can be depicted in a single, comprehensible diagram.
 Back to top
Make any Type of UML Diagram with Gliffy
If you want a quick lesson on how to create UML diagrams using Gliffy, we’ve got you covered with How to Create a UML Diagram.
Ready to jump in and get drawing? Use templates or start from scratch in Gliffy — we're loaded with tools and features (like our Mermaid diagram editor) specifically for making UML diagrams and other software engineering diagrams in just a few clicks.